
- Start >
- Rivers >
- Discharge >
- Obere Donau >
- Reichenbach >
- Chart of year

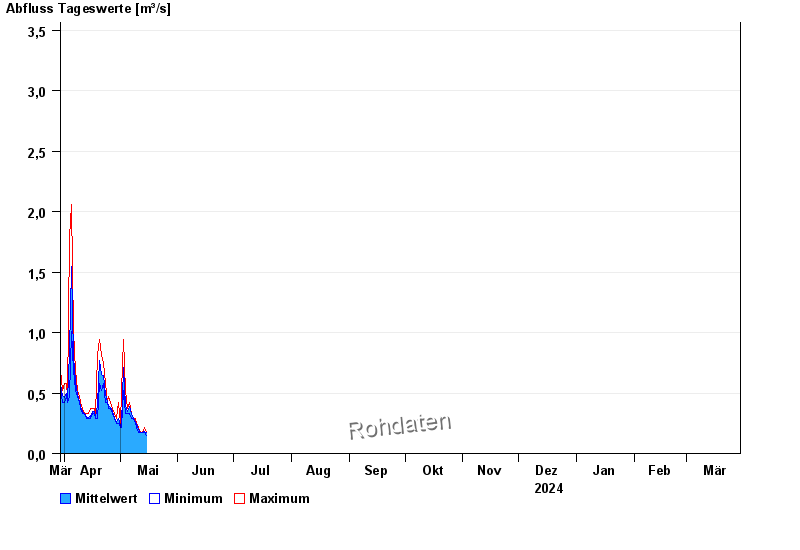
Chart of year Reichenbach / Wörnitz
Discharge from 30.03.2024 to 29.03.2025
- 06.06.1984 Abfluss: 43,2 m³/s
- 01.06.2013 Abfluss: 37,6 m³/s
- 29.10.1998 Abfluss: 32,8 m³/s
- 22.05.1999 Abfluss: 31,5 m³/s
- 21.12.1993 Abfluss: 30,7 m³/s
| Date | Mean value [m³/s] | Maximum [m³/s] | Minimum [m³/s] |
|---|---|---|---|
| 09.08.2024 | 0.085 | 0.085 | 0.085 |
| 08.08.2024 | 0.085 | 0.085 | 0.085 |
| 07.08.2024 | 0.073 | 0.085 | 0.071 |
| 06.08.2024 | 0.085 | 0.085 | 0.085 |
| 05.08.2024 | 0.095 | 0.124 | 0.085 |
| 04.08.2024 | 0.116 | 0.152 | 0.101 |
| 03.08.2024 | 0.107 | 0.152 | 0.101 |
© Bayerisches Landesamt für Umwelt 2024