
- Start >
- Rivers >
- Discharge >
- Obere Donau >
- Tiefenbach >
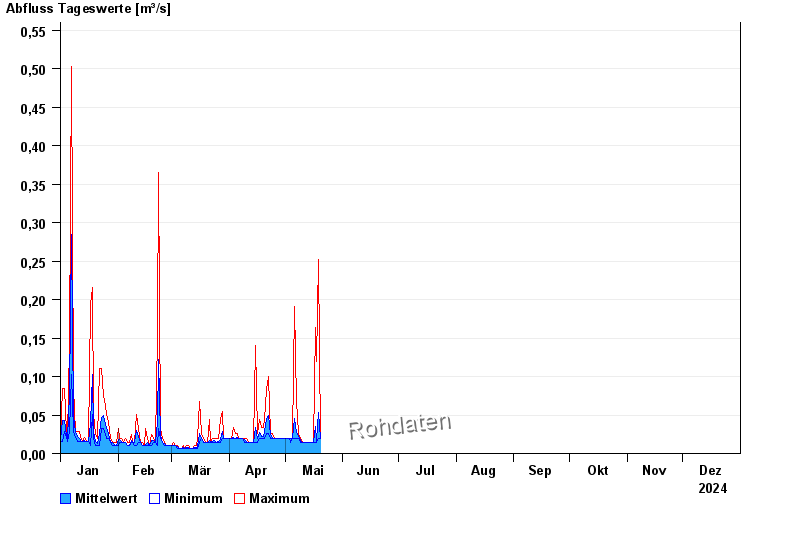
- Chart of year

Chart of year Tiefenbach / Tiefenbach
Discharge from 01.01.2024 to 31.12.2024
| Date | Mean value [m³/s] | Maximum [m³/s] | Minimum [m³/s] |
|---|---|---|---|
| 15.10.2024 | 0.026 | 0.041 | 0.024 |
| 14.10.2024 | 0.026 | 0.066 | 0.024 |
| 13.10.2024 | 0.025 | 0.031 | 0.024 |
| 12.10.2024 | 0.024 | 0.024 | 0.024 |
| 11.10.2024 | 0.024 | 0.024 | 0.024 |
| 10.10.2024 | 0.027 | 0.031 | 0.024 |
| 09.10.2024 | 0.041 | 0.066 | 0.031 |
© Bayerisches Landesamt für Umwelt 2024