
- Start >
- Rivers >
- Discharge >
- Obere Donau >
- Treuchtlingen >
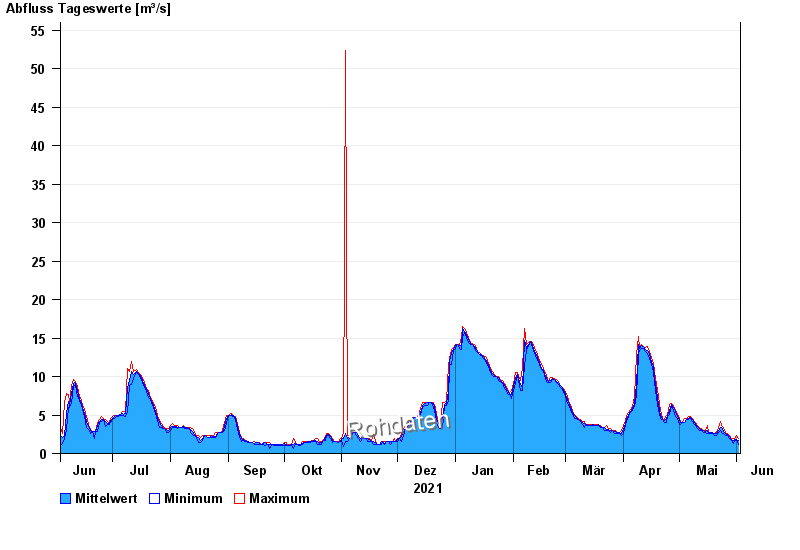
- Chart of year

Chart of year Treuchtlingen / Altmühl
Discharge from 03.06.2021 to 02.06.2022
| Date | Mean value [m³/s] | Maximum [m³/s] | Minimum [m³/s] |
|---|---|---|---|
| 02.06.2022 | 1.63 | 1.91 | 1.16 |
| 01.06.2022 | 1.81 | 2.34 | 1.7 |
| 31.05.2022 | 1.77 | 1.91 | 1.7 |
| 30.05.2022 | 1.69 | 1.91 | 1.32 |
| 29.05.2022 | 1.88 | 1.91 | 1.7 |
| 28.05.2022 | 2.23 | 2.34 | 1.91 |
| 27.05.2022 | 2.46 | 2.56 | 2.34 |
© Bayerisches Landesamt für Umwelt 2024