
- Start >
- Rivers >
- Discharge >
- Obere Donau >
- Treuchtlingen >
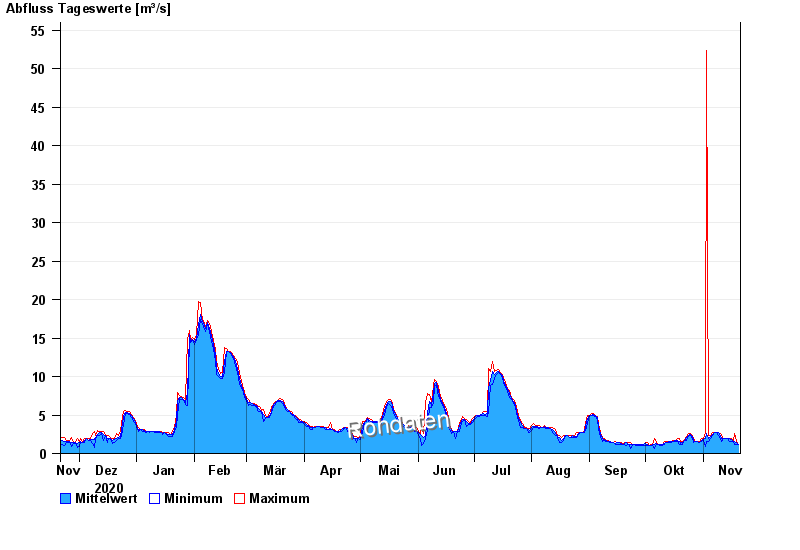
- Chart of year

Chart of year Treuchtlingen / Altmühl
Discharge from 21.11.2020 to 20.11.2021
| Date | Mean value [m³/s] | Maximum [m³/s] | Minimum [m³/s] |
|---|---|---|---|
| 20.11.2021 | 1.21 | 1.21 | 1.21 |
| 19.11.2021 | 1.41 | 1.56 | 1.21 |
| 18.11.2021 | 1.58 | 2.57 | 1.21 |
| 17.11.2021 | 1.56 | 1.56 | 1.56 |
| 16.11.2021 | 1.82 | 1.95 | 1.56 |
| 15.11.2021 | 1.94 | 1.95 | 1.56 |
| 14.11.2021 | 1.95 | 1.95 | 1.95 |
© Bayerisches Landesamt für Umwelt 2024