
- Start >
- Rivers >
- Discharge >
- Obere Donau >
- Wittislingen >
- Chart of year

Chart of year Wittislingen / Egau
Discharge from 29.03.2020 to 28.03.2021
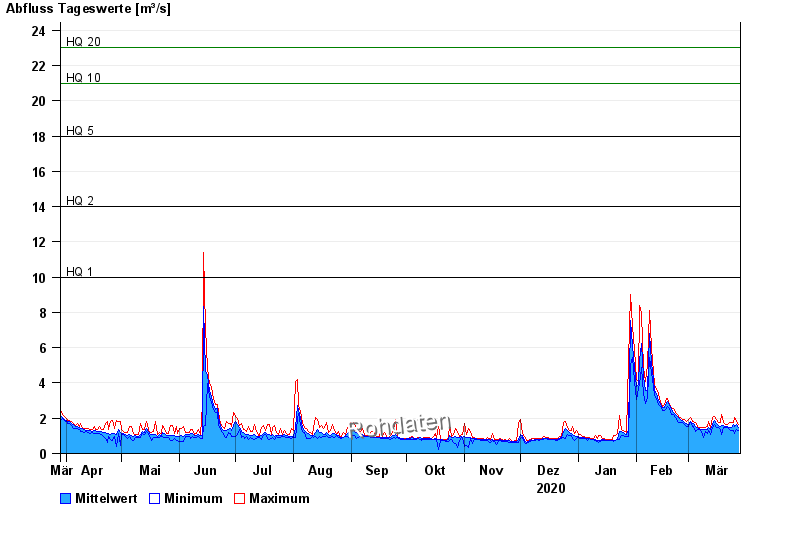
- HQ1 10 m³/s
- HQ2 14 m³/s
- HQ5 18 m³/s
- HQ10 21 m³/s
- HQ20 23 m³/s
- HQ50 26 m³/s
- HQ100 28 m³/s
| Date | Mean value [m³/s] | Maximum [m³/s] | Minimum [m³/s] |
|---|---|---|---|
| 28.03.2021 | 1.48 | 1.64 | 1.31 |
| 27.03.2021 | 1.63 | 1.83 | 1.38 |
| 26.03.2021 | 1.53 | 2.02 | 1.16 |
| 25.03.2021 | 1.66 | 1.73 | 1.31 |
| 24.03.2021 | 1.48 | 1.73 | 1.31 |
| 23.03.2021 | 1.49 | 1.73 | 1.38 |
| 22.03.2021 | 1.54 | 1.64 | 1.46 |
© Bayerisches Landesamt für Umwelt 2024