
- Start >
- Rivers >
- Discharge >
- Unterer Main >
- Amorbach >
- Chart of year

Chart of year Amorbach / Billbach
Discharge from 01.01.2017 to 31.12.2017
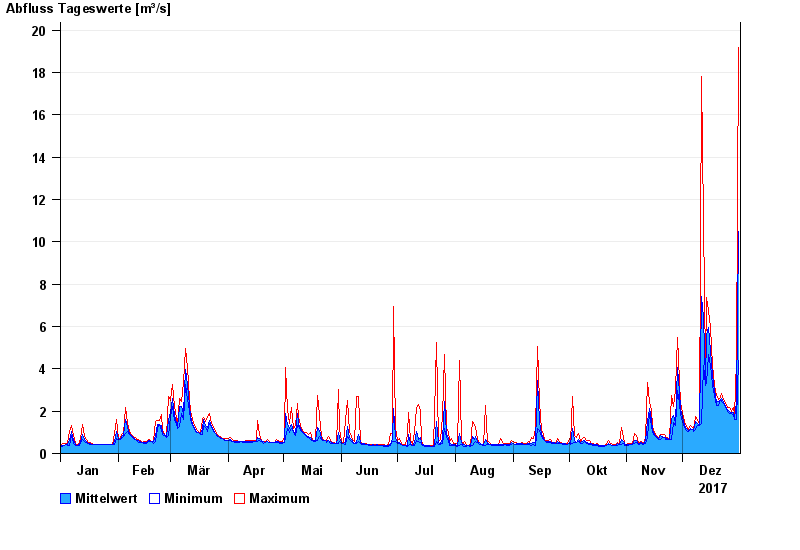
| Date | Mean value [m³/s] | Maximum [m³/s] | Minimum [m³/s] |
|---|---|---|---|
| 31.12.2017 | 10.5 | 19.2 | 4.4 |
| 30.12.2017 | 2.4 | 4.4 | 1.63 |
| 29.12.2017 | 1.67 | 1.81 | 1.62 |
| 28.12.2017 | 1.93 | 2.19 | 1.81 |
| 27.12.2017 | 1.94 | 2 | 1.9 |
| 26.12.2017 | 1.98 | 2.18 | 1.9 |
| 25.12.2017 | 2.06 | 2.18 | 1.99 |
© Bayerisches Landesamt für Umwelt 2025