
- Start >
- Rivers >
- Discharge >
- Unterer Main >
- Arnstein >
- Chart of year

Chart of year Arnstein / Wern
Discharge from 06.08.2019 to 05.08.2020
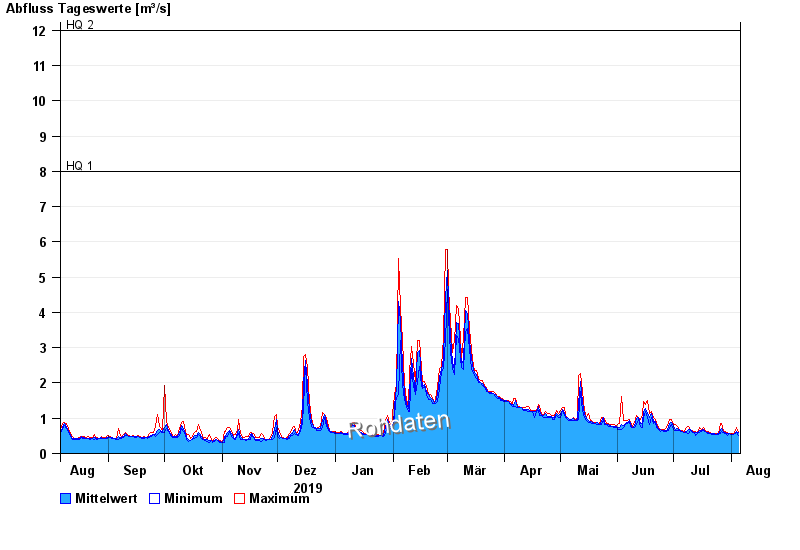
- HQ1 8 m³/s
- HQ2 12 m³/s
- HQ5 18 m³/s
- HQ10 22 m³/s
- HQ20 26 m³/s
- HQ50 32 m³/s
- HQ100 37 m³/s
| Date | Mean value [m³/s] | Maximum [m³/s] | Minimum [m³/s] |
|---|---|---|---|
| 05.08.2020 | 0.471 | 0.474 | 0.449 |
| 04.08.2020 | 0.509 | 0.59 | 0.474 |
| 03.08.2020 | 0.469 | 0.531 | 0.452 |
| 02.08.2020 | 0.432 | 0.453 | 0.429 |
| 01.08.2020 | 0.441 | 0.456 | 0.43 |
| 31.07.2020 | 0.456 | 0.457 | 0.456 |
| 30.07.2020 | 0.451 | 0.484 | 0.433 |
© Bayerisches Landesamt für Umwelt 2025