
- Start >
- Rivers >
- Discharge >
- Unterer Main >
- Arnstein >
- Chart of year

Chart of year Arnstein / Wern
Discharge from 10.08.2020 to 09.08.2021
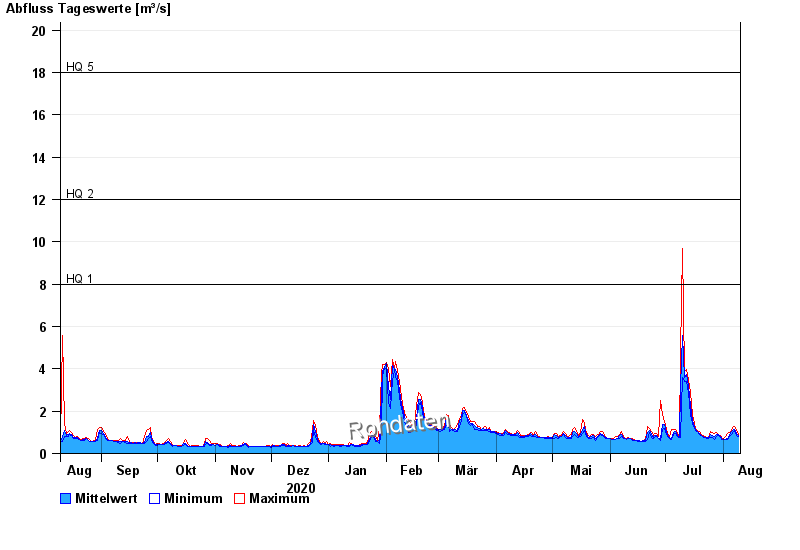
- HQ1 8 m³/s
- HQ2 12 m³/s
- HQ5 18 m³/s
- HQ10 22 m³/s
- HQ20 26 m³/s
- HQ50 32 m³/s
- HQ100 37 m³/s
| Date | Mean value [m³/s] | Maximum [m³/s] | Minimum [m³/s] |
|---|---|---|---|
| 09.08.2021 | 0.855 | 0.921 | 0.794 |
| 08.08.2021 | 0.965 | 1.11 | 0.877 |
| 07.08.2021 | 1.16 | 1.27 | 1.11 |
| 06.08.2021 | 1.16 | 1.27 | 1.07 |
| 05.08.2021 | 1.03 | 1.12 | 0.923 |
| 04.08.2021 | 0.886 | 1.02 | 0.838 |
| 03.08.2021 | 0.74 | 0.97 | 0.653 |
© Bayerisches Landesamt für Umwelt 2024