
- Start >
- Rivers >
- Discharge >
- Unterer Main >
- Arnstein >
- Chart of year

Chart of year Arnstein / Wern
Discharge from 01.01.2024 to 31.12.2024
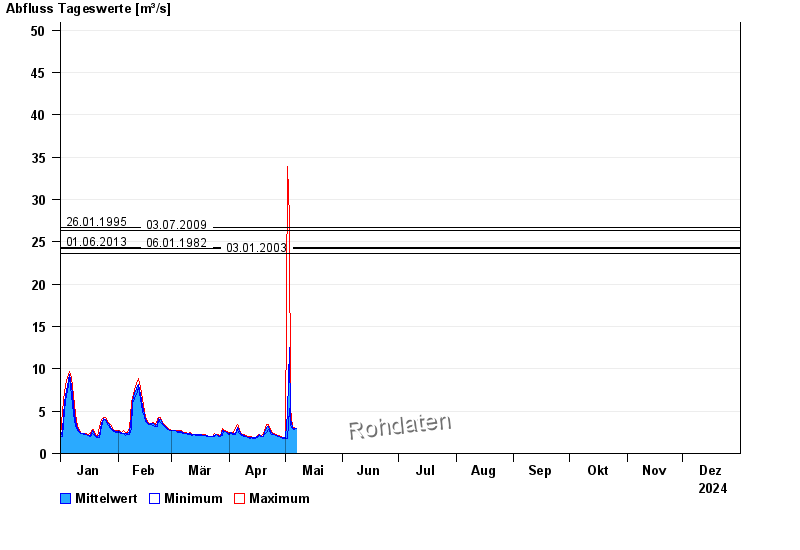
- 26.01.1995 Abfluss: 26,7 m³/s
- 03.07.2009 Abfluss: 26,3 m³/s
- 01.06.2013 Abfluss: 24,3 m³/s
- 06.01.1982 Abfluss: 24,2 m³/s
- 03.01.2003 Abfluss: 23,6 m³/s
| Date | Mean value [m³/s] | Maximum [m³/s] | Minimum [m³/s] |
|---|---|---|---|
| 13.09.2024 | 0.857 | 0.89 | 0.843 |
| 12.09.2024 | 0.878 | 0.934 | 0.843 |
| 11.09.2024 | 0.955 | 1.04 | 0.934 |
| 10.09.2024 | 1.11 | 1.25 | 1.04 |
| 09.09.2024 | 1.07 | 1.19 | 0.934 |
| 08.09.2024 | 0.781 | 0.934 | 0.72 |
| 07.09.2024 | 0.786 | 0.802 | 0.758 |
© Bayerisches Landesamt für Umwelt 2024