
- Start >
- Rivers >
- Discharge >
- Unterer Main >
- Arzberg >
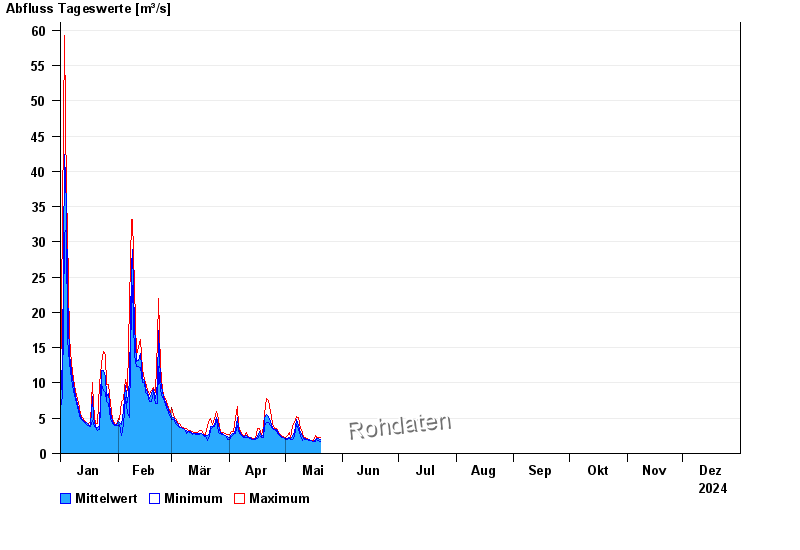
- Chart of year

Chart of year Arzberg / Röslau
Discharge from 01.01.2024 to 31.12.2024
| Date | Mean value [m³/s] | Maximum [m³/s] | Minimum [m³/s] |
|---|---|---|---|
| 31.12.2024 | 2.67 | 2.79 | 2.67 |
| 30.12.2024 | 2.76 | 2.79 | 2.42 |
| 29.12.2024 | 2.9 | 3.06 | 2.79 |
| 28.12.2024 | 3.09 | 3.34 | 2.79 |
| 27.12.2024 | 3.33 | 3.48 | 3.2 |
| 26.12.2024 | 3.63 | 3.78 | 3.48 |
| 25.12.2024 | 4.05 | 4.42 | 3.78 |
© Bayerisches Landesamt für Umwelt 2025