
- Start >
- Rivers >
- Discharge >
- Unterer Main >
- Bad Kissingen Golfplatz >
- Chart of year

Chart of year Bad Kissingen Golfplatz / Fränkische Saale
Discharge from 24.01.2020 to 23.01.2021
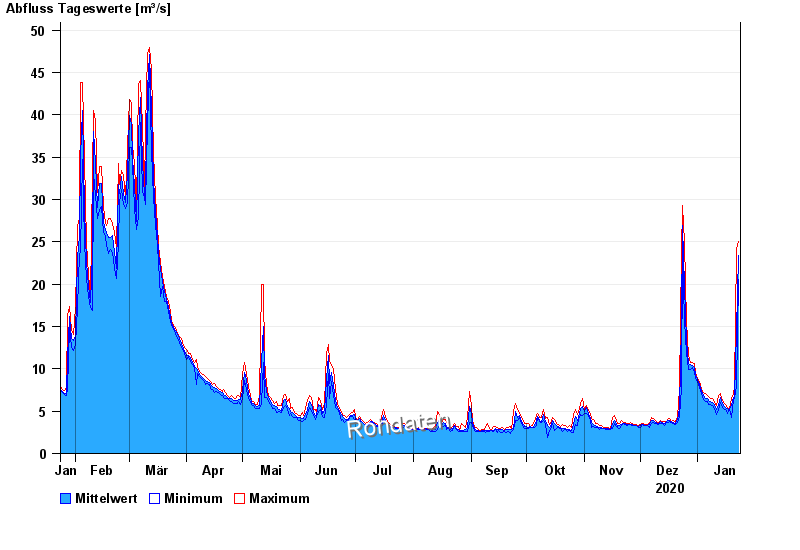
| Date | Mean value [m³/s] | Maximum [m³/s] | Minimum [m³/s] |
|---|---|---|---|
| 23.01.2021 | 23.4 | 25.1 | 20.5 |
| 22.01.2021 | 14.5 | 24.1 | 7.96 |
| 21.01.2021 | 6.73 | 7.96 | 6.51 |
| 20.01.2021 | 6.61 | 7.04 | 6.33 |
| 19.01.2021 | 5.67 | 6.51 | 4.25 |
| 18.01.2021 | 5.2 | 5.34 | 5.17 |
| 17.01.2021 | 5.3 | 5.49 | 4.7 |
© Bayerisches Landesamt für Umwelt 2024