
- Start >
- Rivers >
- Discharge >
- Unterer Main >
- Bad Königshofen im Grabfeld >
- Chart of year

Chart of year Bad Königshofen im Grabfeld / Fränkische Saale
Discharge from 08.06.2023 to 07.06.2024
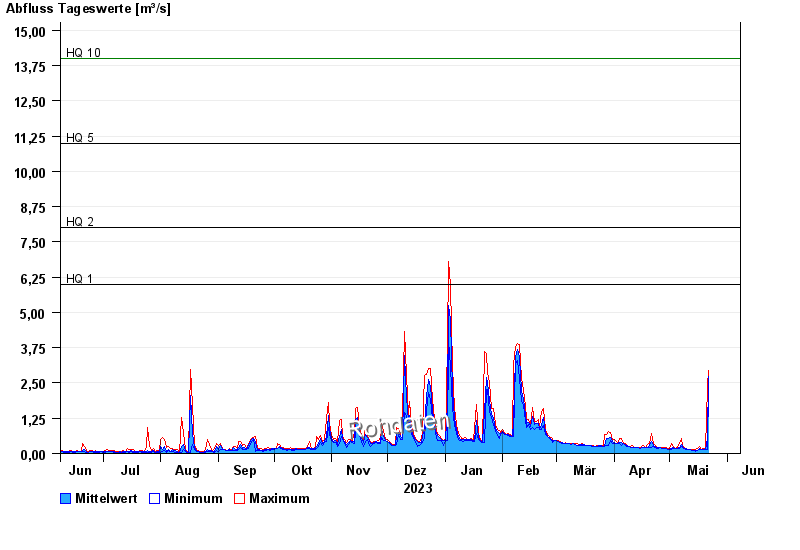
note
Biberaktivität: Werte können durch Aufstau beeinflusst sein
- HQ1 6 m³/s
- HQ2 8 m³/s
- HQ5 11 m³/s
- HQ10 14 m³/s
- HQ20 16 m³/s
- HQ50 18 m³/s
- HQ100 22 m³/s
| Date | Mean value [m³/s] | Maximum [m³/s] | Minimum [m³/s] |
|---|---|---|---|
| 07.06.2024 | 0.18 | 0.195 | 0.165 |
| 06.06.2024 | 0.218 | 0.227 | 0.195 |
| 05.06.2024 | 0.228 | 0.245 | 0.227 |
| 04.06.2024 | 0.304 | 0.359 | 0.245 |
| 03.06.2024 | 0.532 | 0.82 | 0.359 |
| 02.06.2024 | 1.51 | 2.26 | 0.82 |
| 01.06.2024 | 0.45 | 1.05 | 0.245 |
© Bayerisches Landesamt für Umwelt 2024