
- Start >
- Rivers >
- Discharge >
- Unterer Main >
- Bieberehren >
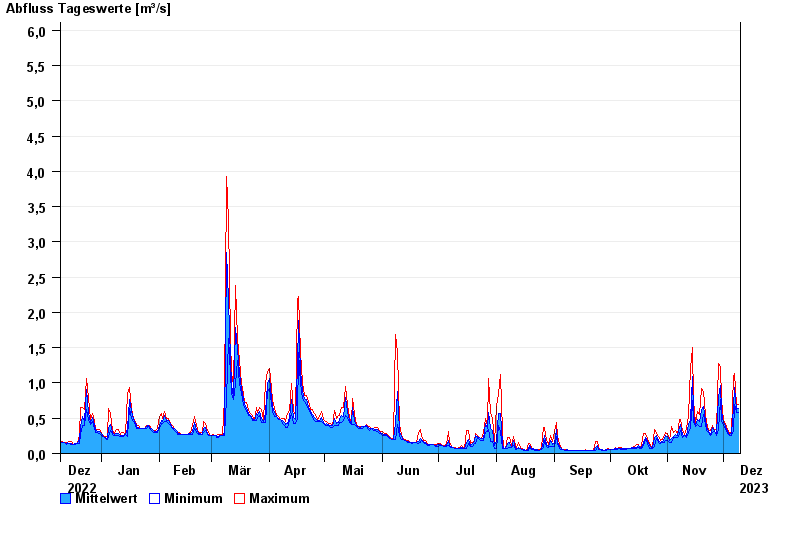
- Chart of year

Chart of year Bieberehren / Gollach
Discharge from 10.12.2022 to 09.12.2023
- 01.06.2013 Abfluss: 36,8 m³/s
- 26.01.1995 Abfluss: 23,4 m³/s
- 10.06.1965 Abfluss: 23 m³/s
- 22.02.1970 Abfluss: 22,2 m³/s
- 31.01.1982 Abfluss: 20,4 m³/s
| Date | Mean value [m³/s] | Maximum [m³/s] | Minimum [m³/s] |
|---|---|---|---|
| 09.12.2023 | 0.634 | 0.696 | 0.579 |
| 08.12.2023 | 0.621 | 0.695 | 0.578 |
| 07.12.2023 | 0.933 | 1.14 | 0.695 |
| 06.12.2023 | 0.65 | 1.09 | 0.314 |
| 05.12.2023 | 0.277 | 0.314 | 0.261 |
| 04.12.2023 | 0.275 | 0.286 | 0.26 |
| 03.12.2023 | 0.316 | 0.34 | 0.285 |
© Bayerisches Landesamt für Umwelt 2024