
- Start >
- Rivers >
- Discharge >
- Unterer Main >
- Birkenfeld >
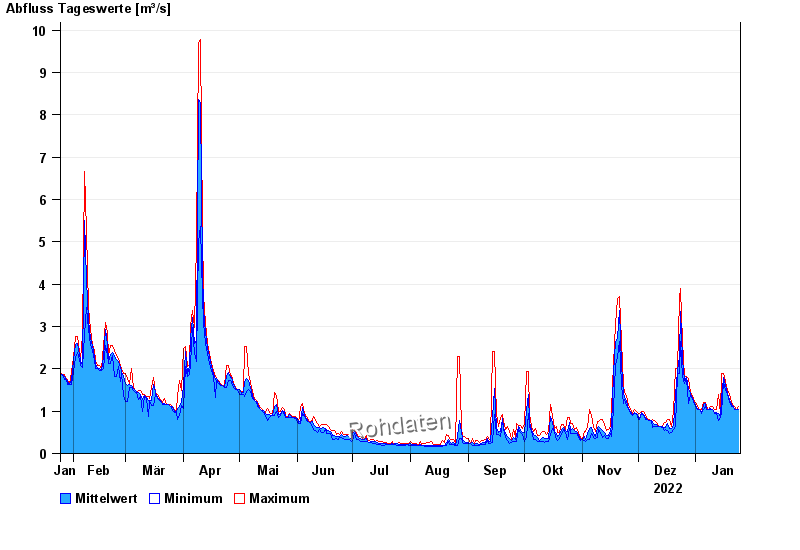
- Chart of year

Chart of year Birkenfeld / Aisch
Discharge from 25.01.2022 to 24.01.2023
| Date | Mean value [m³/s] | Maximum [m³/s] | Minimum [m³/s] |
|---|---|---|---|
| 24.01.2023 | 1.04 | 1.12 | 1.03 |
| 23.01.2023 | 1.03 | 1.03 | 1.03 |
| 22.01.2023 | 1.03 | 1.12 | 1.03 |
| 21.01.2023 | 1.12 | 1.12 | 1.12 |
| 20.01.2023 | 1.15 | 1.21 | 1.12 |
| 19.01.2023 | 1.28 | 1.4 | 1.21 |
| 18.01.2023 | 1.41 | 1.49 | 1.4 |
© Bayerisches Landesamt für Umwelt 2024