
- Start >
- Rivers >
- Discharge >
- Unterer Main >
- Gollmuthhausen >
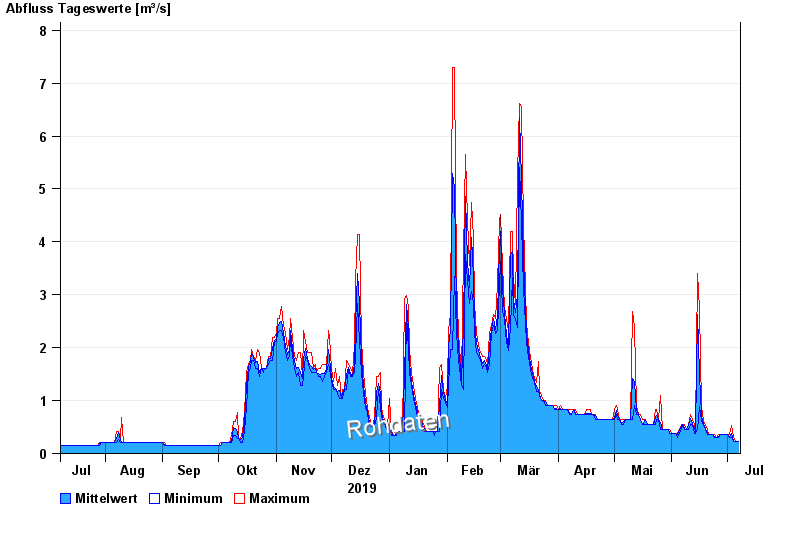
- Chart of year

Chart of year Gollmuthhausen / Milz
Discharge from 08.07.2019 to 07.07.2020
| Date | Mean value [m³/s] | Maximum [m³/s] | Minimum [m³/s] |
|---|---|---|---|
| 07.07.2020 | 0.231 | 0.231 | 0.231 |
| 06.07.2020 | 0.231 | 0.231 | 0.231 |
| 05.07.2020 | 0.231 | 0.231 | 0.231 |
| 04.07.2020 | 0.253 | 0.296 | 0.231 |
| 03.07.2020 | 0.373 | 0.532 | 0.296 |
| 02.07.2020 | 0.309 | 0.367 | 0.296 |
| 01.07.2020 | 0.367 | 0.367 | 0.367 |
© Bayerisches Landesamt für Umwelt 2024