
- Start >
- Rivers >
- Discharge >
- Unterer Main >
- Hafenlohr >
- Chart of year

Chart of year Hafenlohr / Hafenlohr
Discharge from 18.09.2021 to 17.09.2022
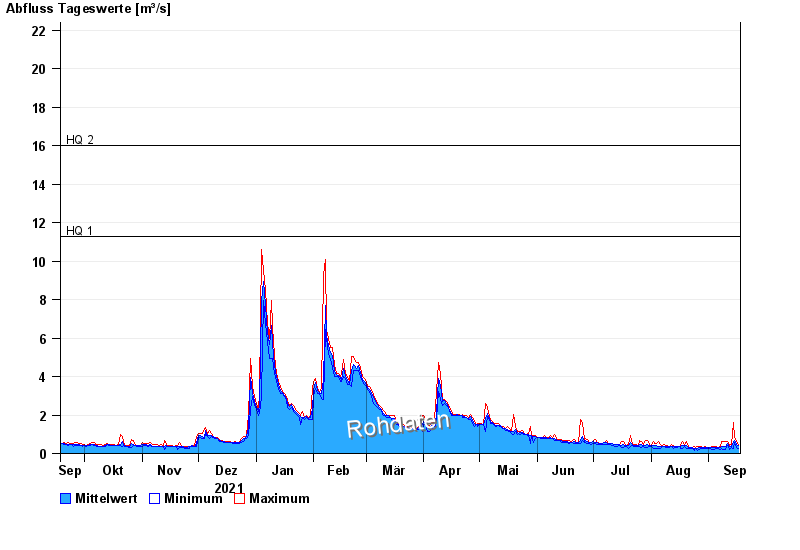
- HQ1 11,3 m³/s
- HQ2 16 m³/s
- HQ5 23 m³/s
- HQ10 28 m³/s
- HQ20 33 m³/s
- HQ50 40 m³/s
- HQ100 45 m³/s
| Date | Mean value [m³/s] | Maximum [m³/s] | Minimum [m³/s] |
|---|---|---|---|
| 17.09.2022 | 0.394 | 0.446 | 0.238 |
| 16.09.2022 | 0.455 | 0.612 | 0.312 |
| 15.09.2022 | 0.688 | 0.883 | 0.554 |
| 14.09.2022 | 0.635 | 1.77 | 0.239 |
| 13.09.2022 | 0.339 | 0.448 | 0.313 |
| 12.09.2022 | 0.352 | 0.401 | 0.207 |
| 11.09.2022 | 0.502 | 0.616 | 0.401 |
© Bayerisches Landesamt für Umwelt 2024