
- Start >
- Rivers >
- Discharge >
- Unterer Main >
- Hafenlohr >
- Chart of year

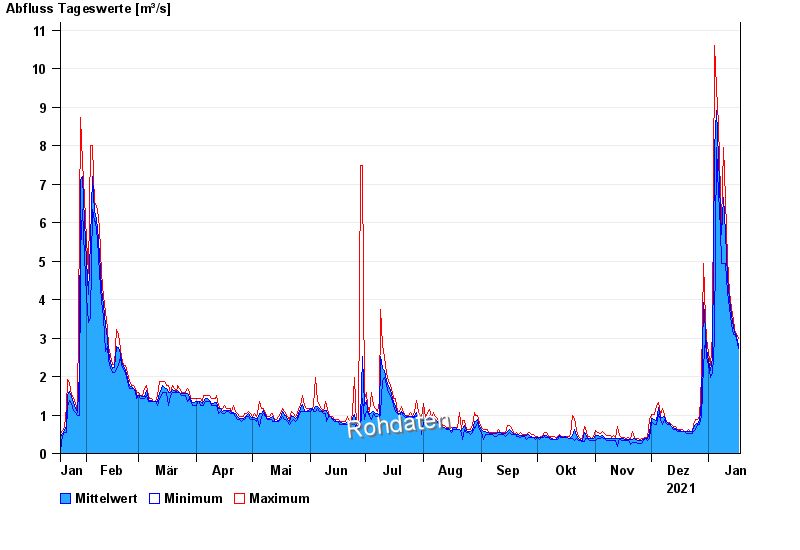
Chart of year Hafenlohr / Hafenlohr
Discharge from 18.01.2021 to 17.01.2022
| Date | Mean value [m³/s] | Maximum [m³/s] | Minimum [m³/s] |
|---|---|---|---|
| 17.01.2022 | 3.12 | 3.3 | 3.03 |
| 16.01.2022 | 3.35 | 3.44 | 3.3 |
| 15.01.2022 | 3.49 | 3.58 | 3.43 |
| 14.01.2022 | 3.65 | 3.87 | 3.43 |
| 13.01.2022 | 3.98 | 4.18 | 3.72 |
| 12.01.2022 | 4.45 | 4.65 | 4.17 |
| 11.01.2022 | 5.07 | 5.61 | 4.65 |
© Bayerisches Landesamt für Umwelt 2024