
- Start >
- Rivers >
- Discharge >
- Unterer Main >
- Heinersdorf >
- Chart of year

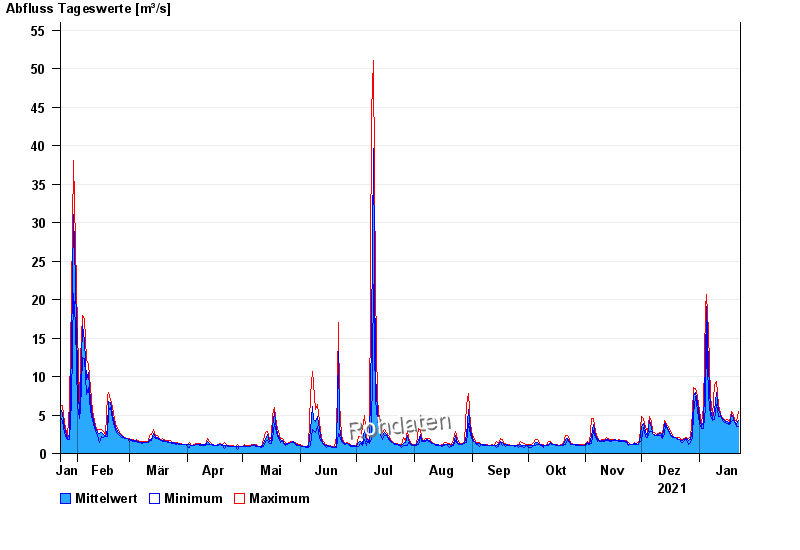
Chart of year Heinersdorf / Rodach
Discharge from 23.01.2021 to 22.01.2022
| Date | Mean value [m³/s] | Maximum [m³/s] | Minimum [m³/s] |
|---|---|---|---|
| 22.01.2022 | 4.24 | 5.41 | 3.56 |
| 21.01.2022 | 3.81 | 4.14 | 3.56 |
| 20.01.2022 | 4.16 | 4.36 | 4.06 |
| 19.01.2022 | 4.61 | 5.02 | 4.36 |
| 18.01.2022 | 5.09 | 5.48 | 4.21 |
| 17.01.2022 | 3.83 | 4.14 | 3.71 |
| 16.01.2022 | 4.19 | 4.36 | 3.92 |
© Bayerisches Landesamt für Umwelt 2024