
- Start >
- Rivers >
- Discharge >
- Unterer Main >
- Oberthulba >
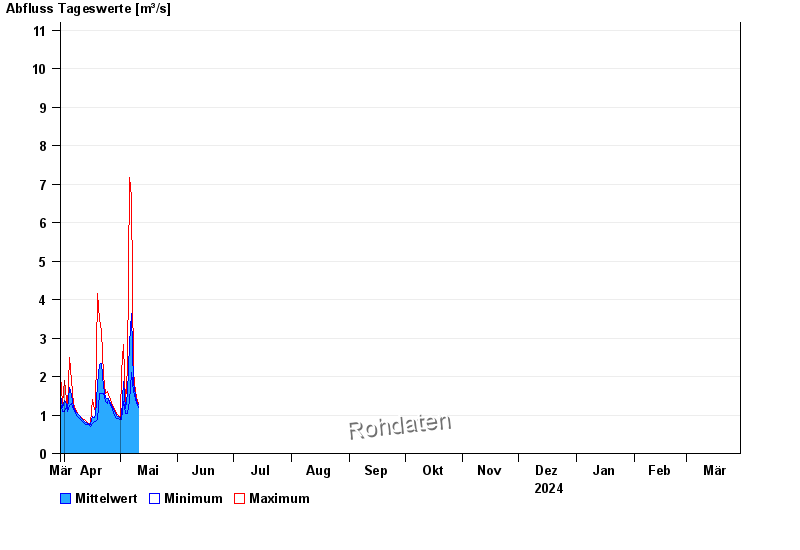
- Chart of year

Chart of year Oberthulba / Thulba
Discharge from 30.03.2024 to 29.03.2025
- 07.02.1984 Abfluss: 45,6 m³/s
- 23.01.1995 Abfluss: 43,5 m³/s
- 03.01.2003 Abfluss: 42,1 m³/s
- 13.01.2011 Abfluss: 30,1 m³/s
- 21.01.2005 Abfluss: 30,1 m³/s
| Date | Mean value [m³/s] | Maximum [m³/s] | Minimum [m³/s] |
|---|---|---|---|
| 18.07.2024 | 0.266 | 0.266 | 0.266 |
| 17.07.2024 | 0.287 | 0.304 | 0.266 |
| 16.07.2024 | 0.355 | 0.45 | 0.284 |
| 15.07.2024 | 0.271 | 0.284 | 0.249 |
| 14.07.2024 | 0.289 | 0.304 | 0.266 |
| 13.07.2024 | 0.34 | 0.398 | 0.284 |
| 12.07.2024 | 0.535 | 1 | 0.348 |
© Bayerisches Landesamt für Umwelt 2024