
- Start >
- Rivers >
- Discharge >
- Unterer Main >
- Pfarrweisach >
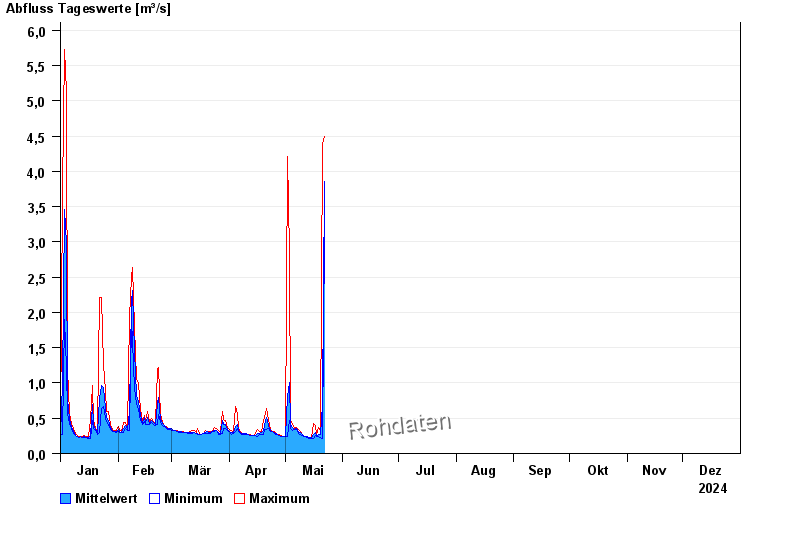
- Chart of year

Chart of year Pfarrweisach / Weisach
Discharge from 01.01.2024 to 31.12.2024
| Date | Mean value [m³/s] | Maximum [m³/s] | Minimum [m³/s] |
|---|---|---|---|
| 13.09.2024 | 0.113 | 0.113 | 0.113 |
| 12.09.2024 | 0.109 | 0.113 | 0.102 |
| 11.09.2024 | 0.112 | 0.113 | 0.102 |
| 10.09.2024 | 0.118 | 0.123 | 0.113 |
| 09.09.2024 | 0.202 | 0.502 | 0.113 |
| 08.09.2024 | 0.087 | 0.113 | 0.059 |
| 07.09.2024 | 0.103 | 0.462 | 0.059 |
© Bayerisches Landesamt für Umwelt 2024