
- Start >
- Rivers >
- Discharge >
- Unterer Main >
- Pfarrweisach >
- Chart of year

Chart of year Pfarrweisach / Weisach
Discharge from 01.01.2021 to 31.12.2021
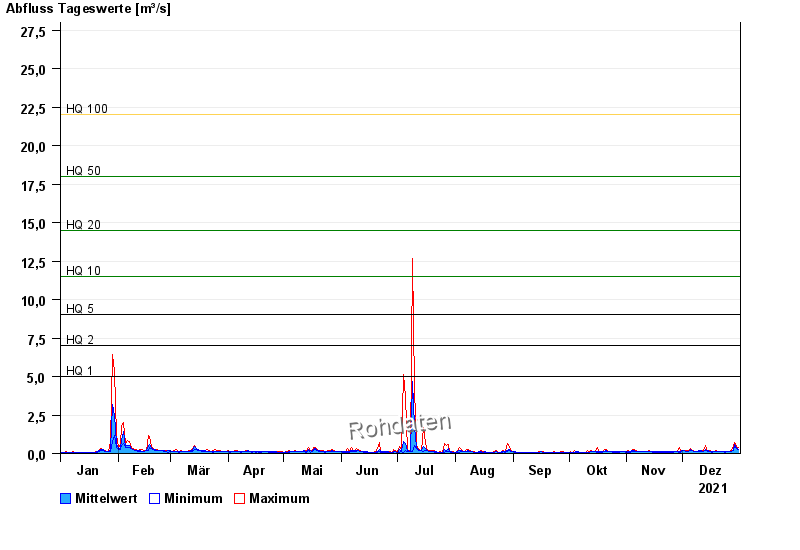
- HQ1 5 m³/s
- HQ2 7 m³/s
- HQ5 9 m³/s
- HQ10 11,5 m³/s
- HQ20 14,5 m³/s
- HQ50 18 m³/s
- HQ100 22 m³/s
| Date | Mean value [m³/s] | Maximum [m³/s] | Minimum [m³/s] |
|---|---|---|---|
| 31.12.2021 | 0.278 | 0.37 | 0.239 |
| 30.12.2021 | 0.418 | 0.484 | 0.334 |
| 29.12.2021 | 0.561 | 0.706 | 0.425 |
| 28.12.2021 | 0.252 | 0.425 | 0.171 |
| 27.12.2021 | 0.146 | 0.171 | 0.114 |
| 26.12.2021 | 0.122 | 0.124 | 0.114 |
| 25.12.2021 | 0.124 | 0.124 | 0.124 |
© Bayerisches Landesamt für Umwelt 2024