
- Start >
- Rivers >
- Discharge >
- Unterer Main >
- Sachsenheim >
- Chart of year

Chart of year Sachsenheim / Wern
Discharge from 24.04.2024 to 23.04.2025
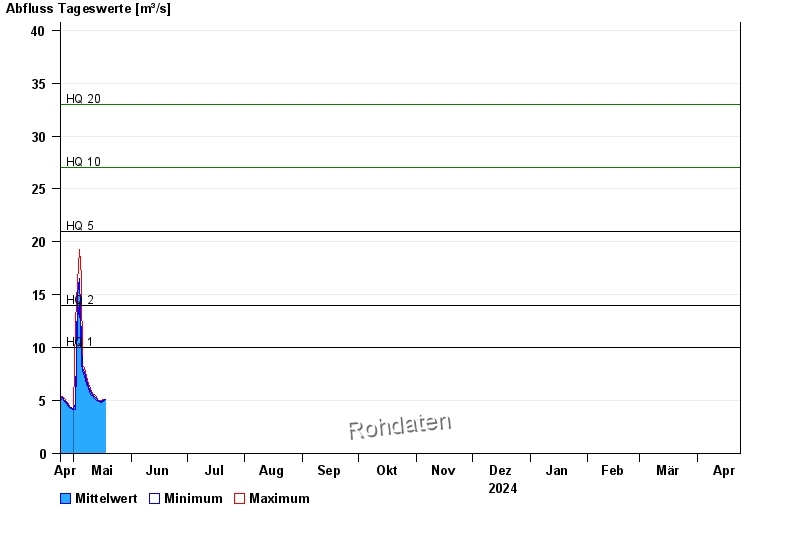
- HQ1 10 m³/s
- HQ2 14 m³/s
- HQ5 21 m³/s
- HQ10 27 m³/s
- HQ20 33 m³/s
- HQ50 44 m³/s
- HQ100 53 m³/s
| Date | Mean value [m³/s] | Maximum [m³/s] | Minimum [m³/s] |
|---|---|---|---|
| 18.09.2024 | 1.76 | 1.79 | 1.71 |
| 17.09.2024 | 1.77 | 1.79 | 1.71 |
| 16.09.2024 | 1.69 | 1.79 | 1.64 |
| 15.09.2024 | 1.66 | 1.71 | 1.64 |
| 14.09.2024 | 1.7 | 1.79 | 1.64 |
| 13.09.2024 | 1.76 | 1.79 | 1.71 |
| 12.09.2024 | 1.84 | 1.95 | 1.79 |
© Bayerisches Landesamt für Umwelt 2024