
- Start >
- Rivers >
- Discharge >
- Unterer Main >
- Schweinfurt Neuer Hafen >
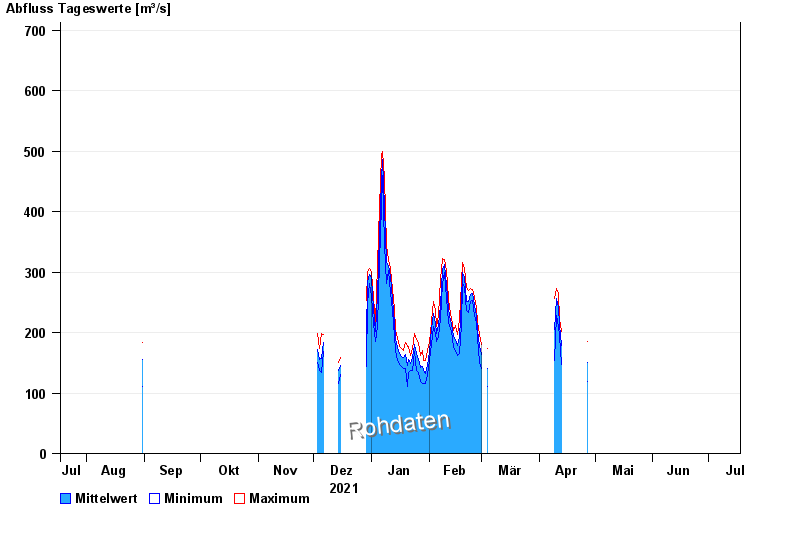
- Chart of year

Chart of year Schweinfurt Neuer Hafen / Main
Discharge from 18.07.2021 to 17.07.2022
- 29.03.1845 Abfluss: 2000 m³/s
- 06.02.1909 Abfluss: 1700 m³/s
- 09.02.1848 Abfluss: 1610 m³/s
- 18.02.1876 Abfluss: 1480 m³/s
- 28.12.1882 Abfluss: 1450 m³/s
| Date | Mean value [m³/s] | Maximum [m³/s] | Minimum [m³/s] |
|---|---|---|---|
| 17.07.2022 | 38.3 | 59.7 | 25 |
| 16.07.2022 | 44.1 | 62.9 | 30.9 |
| 15.07.2022 | 45.8 | 61.5 | 33.5 |
| 14.07.2022 | 48.9 | 62.1 | 32.2 |
| 13.07.2022 | 51.1 | 65.2 | 34.5 |
| 12.07.2022 | 51.2 | 63.1 | 39.2 |
| 11.07.2022 | 48.1 | 60.8 | 33.8 |
© Bayerisches Landesamt für Umwelt 2024