
- Start >
- Rivers >
- Discharge >
- Unterer Main >
- Trunstadt >
- Chart of year

Chart of year Trunstadt / Main
Discharge from 29.03.2024 to 28.03.2025
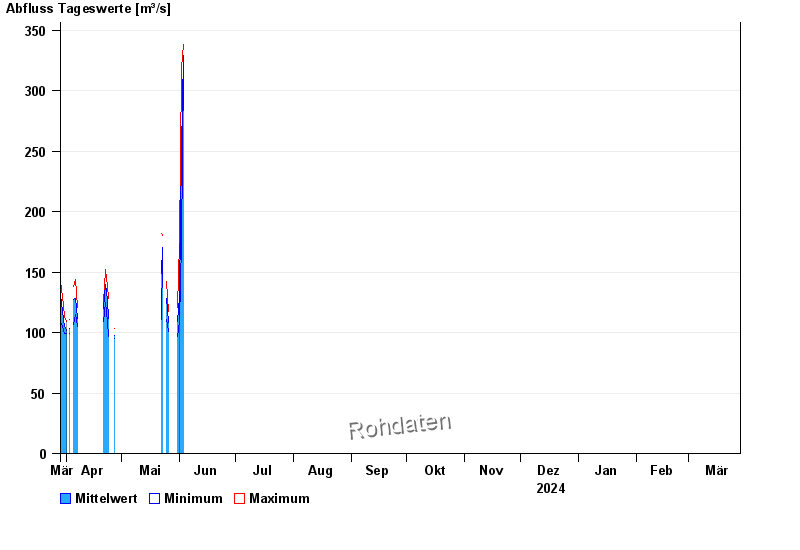
| Date | Mean value [m³/s] | Maximum [m³/s] | Minimum [m³/s] |
|---|---|---|---|
| 13.07.2024 | 101 | 103 | 99 |
| 12.07.2024 | 109 | 117 | 101 |
| 11.07.2024 | 106 | 113 | 97 |
| 10.07.2024 | -- | -- | -- |
| 09.07.2024 | -- | -- | -- |
| 08.07.2024 | 108 | 119 | 101 |
| 07.07.2024 | 108 | 115 | 97 |
© Bayerisches Landesamt für Umwelt 2024