
- Start >
- Rivers >
- Discharge >
- Unterer Main >
- Weilbach >
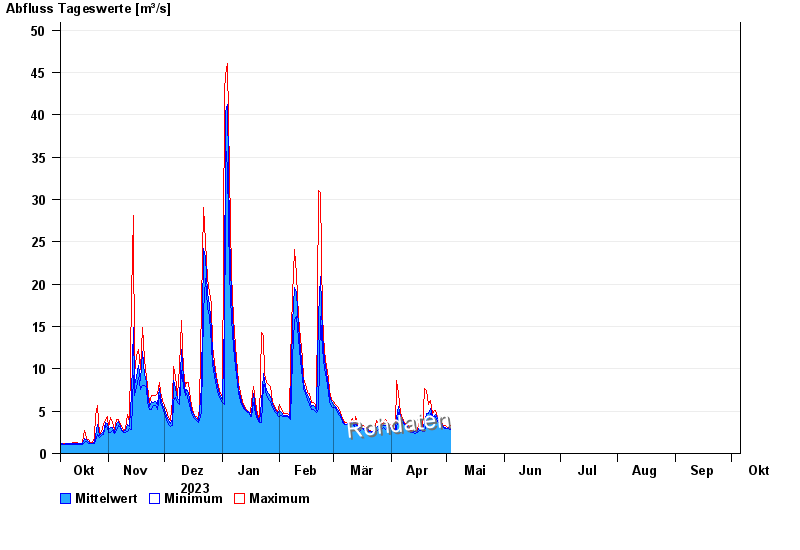
- Chart of year

Chart of year Weilbach / Mud
Discharge from 06.10.2023 to 05.10.2024
| Date | Mean value [m³/s] | Maximum [m³/s] | Minimum [m³/s] |
|---|---|---|---|
| 05.10.2024 | 1.6 | 1.71 | 1.46 |
| 04.10.2024 | 1.64 | 1.71 | 1.54 |
| 03.10.2024 | 1.9 | 2.29 | 1.62 |
| 02.10.2024 | 1.97 | 2.63 | 1.71 |
| 01.10.2024 | 1.99 | 2.29 | 1.71 |
| 30.09.2024 | 1.49 | 1.71 | 1.39 |
| 29.09.2024 | 1.52 | 1.62 | 1.39 |
© Bayerisches Landesamt für Umwelt 2024