
- Start >
- Rivers >
- Discharge >
- Naab - Regen >
- Arnstein >
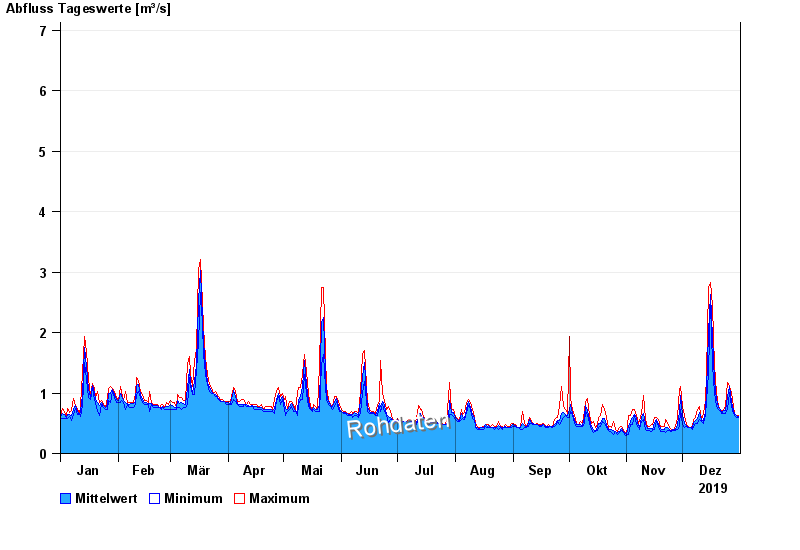
- Chart of year

Chart of year Arnstein / Wern
Discharge from 01.01.2019 to 31.12.2019
- HQ1 8 m³/s
- HQ2 12 m³/s
- HQ5 18 m³/s
- HQ10 22 m³/s
- HQ20 26 m³/s
- HQ50 32 m³/s
- HQ100 37 m³/s
| Date | Mean value [m³/s] | Maximum [m³/s] | Minimum [m³/s] |
|---|---|---|---|
| 31.12.2019 | 0.635 | 0.65 | 0.616 |
| 30.12.2019 | 0.648 | 0.65 | 0.617 |
| 29.12.2019 | 0.681 | 0.686 | 0.65 |
| 28.12.2019 | 0.745 | 0.805 | 0.686 |
| 27.12.2019 | 0.897 | 1.04 | 0.805 |
| 26.12.2019 | 1.13 | 1.15 | 1.04 |
| 25.12.2019 | 0.981 | 1.2 | 0.765 |
© Bayerisches Landesamt für Umwelt 2024