
- Start >
- Rivers >
- Discharge >
- Naab - Regen >
- Bayreuth >
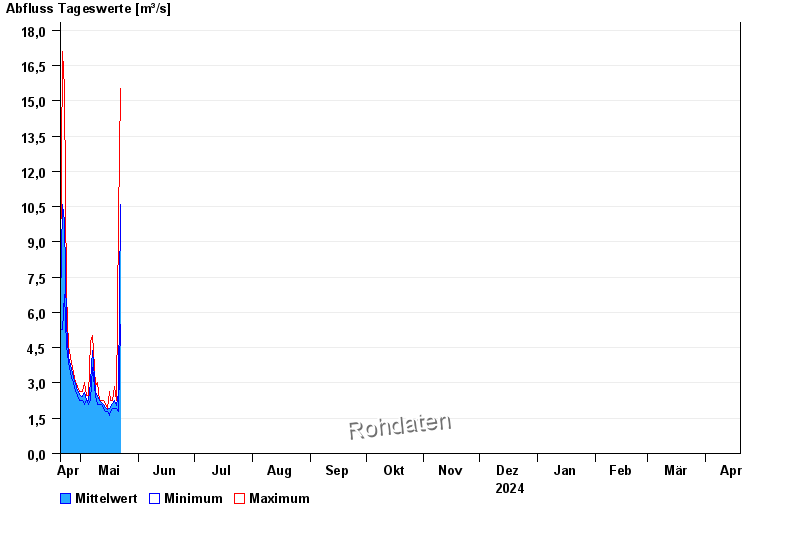
- Chart of year

Chart of year Bayreuth / Roter Main
Discharge from 20.04.2024 to 19.04.2025
| Date | Mean value [m³/s] | Maximum [m³/s] | Minimum [m³/s] |
|---|---|---|---|
| 15.10.2024 | 1.88 | 2.09 | 1.76 |
| 14.10.2024 | 1.7 | 1.92 | 1.61 |
| 13.10.2024 | 2.17 | 3.21 | 1.76 |
| 12.10.2024 | 3.03 | 4.06 | 2.26 |
| 11.10.2024 | 3.32 | 4.97 | 1.92 |
| 10.10.2024 | 2.08 | 2.81 | 1.61 |
| 09.10.2024 | 3.66 | 4.28 | 2.81 |
© Bayerisches Landesamt für Umwelt 2024