
- Start >
- Rivers >
- Discharge >
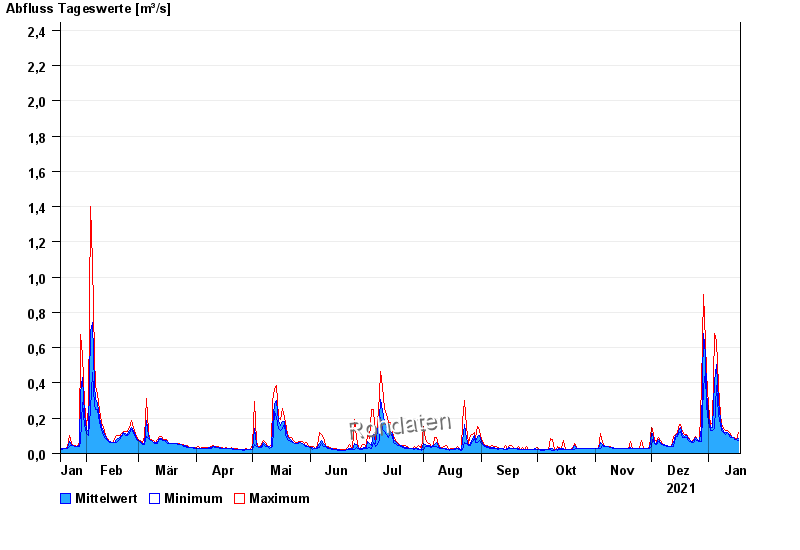
- Naab - Regen >
- Friedersreuth >
- Chart of year

Chart of year Friedersreuth / Schweinnaab
Discharge from 18.01.2021 to 17.01.2022
 Für diesen Pegel sind keine Jährlichkeiten hinterlegt.
| Date | Mean value [m³/s] | Maximum [m³/s] | Minimum [m³/s] |
|---|---|---|---|
| 17.01.2022 | 0.097 | 0.128 | 0.082 |
| 16.01.2022 | 0.09 | 0.09 | 0.09 |
| 15.01.2022 | 0.095 | 0.099 | 0.09 |
| 14.01.2022 | 0.099 | 0.099 | 0.099 |
| 13.01.2022 | 0.106 | 0.108 | 0.099 |
| 12.01.2022 | 0.116 | 0.129 | 0.108 |
| 11.01.2022 | 0.131 | 0.14 | 0.129 |
© Bayerisches Landesamt für Umwelt 2024