
- Start >
- Rivers >
- Discharge >
- Naab - Regen >
- Fronhof >
- Chart of year

Chart of year Fronhof / Murach
Discharge from 01.01.2018 to 31.12.2018
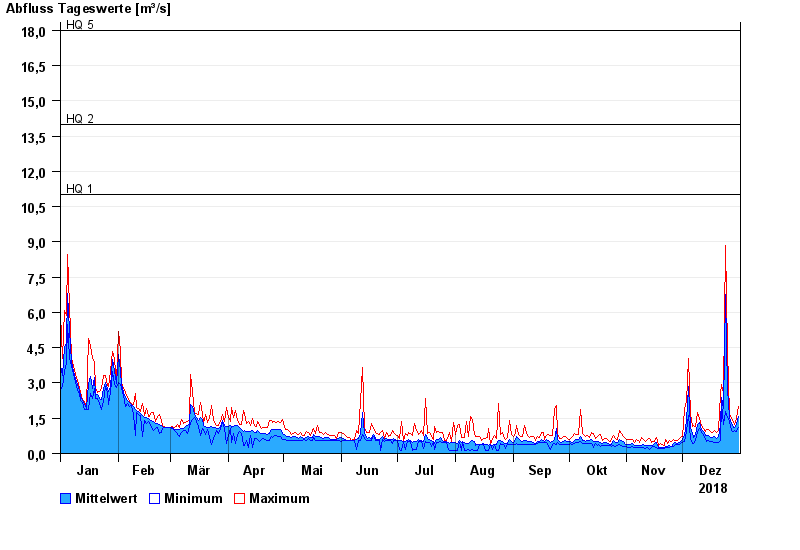
- HQ1 11 m³/s
- HQ2 14 m³/s
- HQ5 18 m³/s
- HQ10 21 m³/s
- HQ20 24 m³/s
- HQ50 28 m³/s
- HQ100 30 m³/s
| Date | Mean value [m³/s] | Maximum [m³/s] | Minimum [m³/s] |
|---|---|---|---|
| 31.12.2018 | 1.58 | 2 | 1.1 |
| 30.12.2018 | 1.23 | 1.5 | 0.95 |
| 29.12.2018 | 1.09 | 1.25 | 0.984 |
| 28.12.2018 | 1.12 | 1.33 | 0.948 |
| 27.12.2018 | 1.29 | 1.49 | 0.981 |
| 26.12.2018 | 1.54 | 1.66 | 1.37 |
| 25.12.2018 | 2.72 | 4.43 | 1.53 |
© Bayerisches Landesamt für Umwelt 2024