
- Start >
- Rivers >
- Discharge >
- Naab - Regen >
- Fronhof >
- Chart of year

Chart of year Fronhof / Murach
Discharge from 01.01.2020 to 31.12.2020
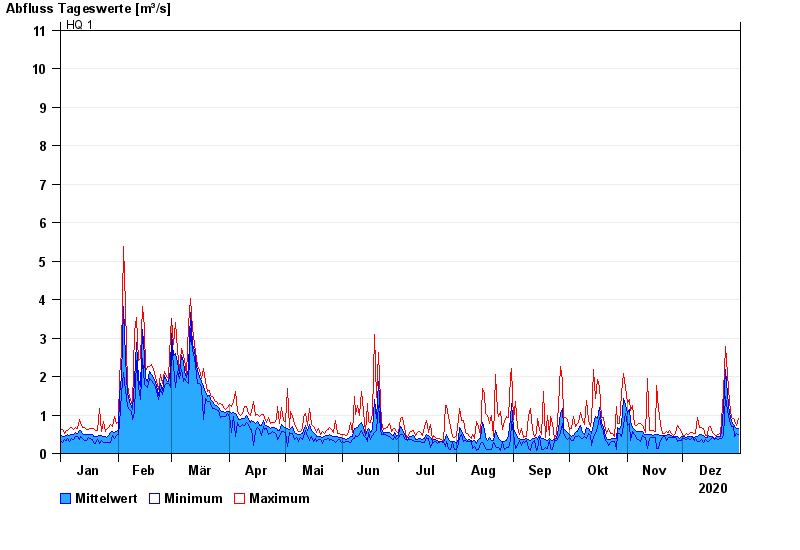
- HQ1 11 m³/s
- HQ2 14 m³/s
- HQ5 18 m³/s
- HQ10 21 m³/s
- HQ20 24 m³/s
- HQ50 28 m³/s
- HQ100 30 m³/s
| Date | Mean value [m³/s] | Maximum [m³/s] | Minimum [m³/s] |
|---|---|---|---|
| 31.12.2020 | 0.651 | 0.899 | 0.505 |
| 30.12.2020 | 0.638 | 0.733 | 0.531 |
| 29.12.2020 | 0.712 | 0.864 | 0.43 |
| 28.12.2020 | 0.756 | 0.899 | 0.702 |
| 27.12.2020 | 0.837 | 0.934 | 0.702 |
| 26.12.2020 | 1.05 | 1.32 | 0.864 |
| 25.12.2020 | 1.54 | 2.08 | 1.12 |
© Bayerisches Landesamt für Umwelt 2024