
- Start >
- Rivers >
- Discharge >
- Naab - Regen >
- Gampelmühle >
- Chart of year

Chart of year Gampelmühle / Ölschnitz
Discharge from 01.01.2024 to 31.12.2024
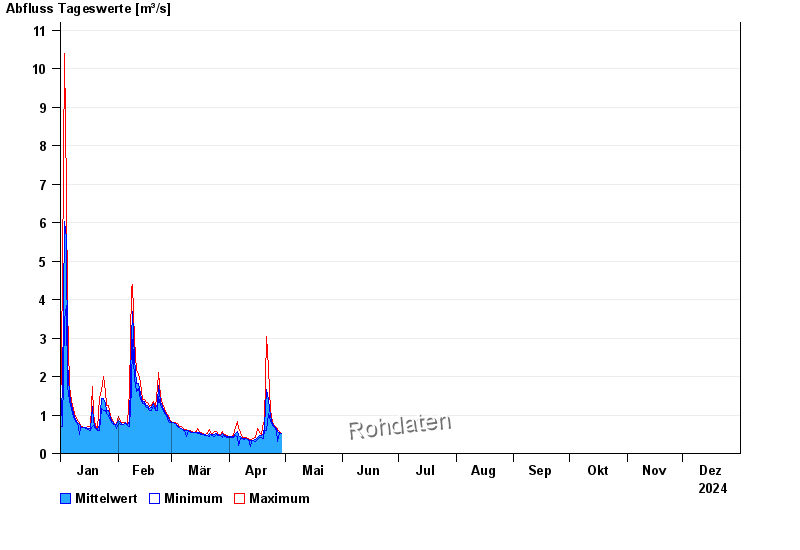
| Date | Mean value [m³/s] | Maximum [m³/s] | Minimum [m³/s] |
|---|---|---|---|
| 17.07.2024 | 0.291 | 0.366 | 0.285 |
| 16.07.2024 | 0.302 | 0.324 | 0.285 |
| 15.07.2024 | 0.314 | 0.345 | 0.285 |
| 14.07.2024 | 0.388 | 0.456 | 0.265 |
| 13.07.2024 | 0.826 | 1.78 | 0.456 |
| 12.07.2024 | 0.324 | 0.825 | 0.304 |
| 11.07.2024 | 0.375 | 0.631 | 0.247 |
© Bayerisches Landesamt für Umwelt 2024