
- Start >
- Rivers >
- Discharge >
- Naab - Regen >
- Hammerles >
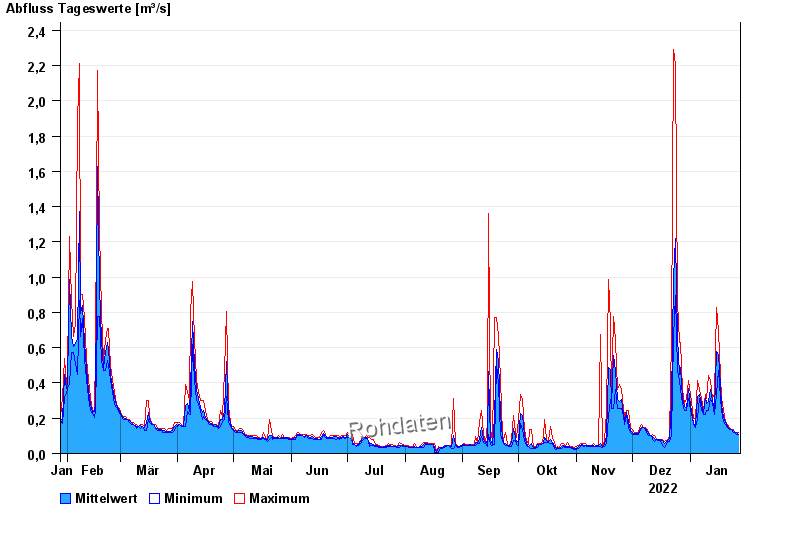
- Chart of year

Chart of year Hammerles / Schweinnaab
Discharge from 28.01.2022 to 27.01.2023
| Date | Mean value [m³/s] | Maximum [m³/s] | Minimum [m³/s] |
|---|---|---|---|
| 27.01.2023 | 0.11 | 0.121 | 0.11 |
| 26.01.2023 | 0.121 | 0.121 | 0.11 |
| 25.01.2023 | 0.121 | 0.121 | 0.121 |
| 24.01.2023 | 0.133 | 0.134 | 0.121 |
| 23.01.2023 | 0.134 | 0.134 | 0.134 |
| 22.01.2023 | 0.142 | 0.149 | 0.134 |
| 21.01.2023 | 0.155 | 0.164 | 0.149 |
© Bayerisches Landesamt für Umwelt 2024