
- Start >
- Rivers >
- Discharge >
- Naab - Regen >
- Hirschbach >
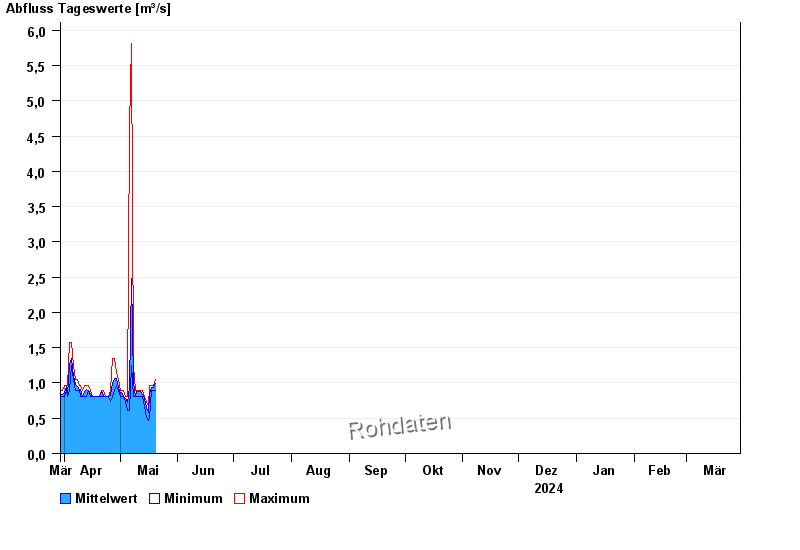
- Chart of year

Chart of year Hirschbach / Kleiner Regen
Discharge from 30.03.2024 to 29.03.2025
| Date | Mean value [m³/s] | Maximum [m³/s] | Minimum [m³/s] |
|---|---|---|---|
| 09.08.2024 | 0.255 | 0.285 | 0.236 |
| 08.08.2024 | 0.269 | 0.339 | 0.225 |
| 07.08.2024 | 0.226 | 0.236 | 0.225 |
| 06.08.2024 | 0.233 | 0.248 | 0.225 |
| 05.08.2024 | 0.26 | 0.272 | 0.236 |
| 04.08.2024 | 0.26 | 0.272 | 0.26 |
| 03.08.2024 | 0.26 | 0.26 | 0.26 |
© Bayerisches Landesamt für Umwelt 2024