
- Start >
- Rivers >
- Discharge >
- Naab - Regen >
- Hocha Perlseeabfluss >
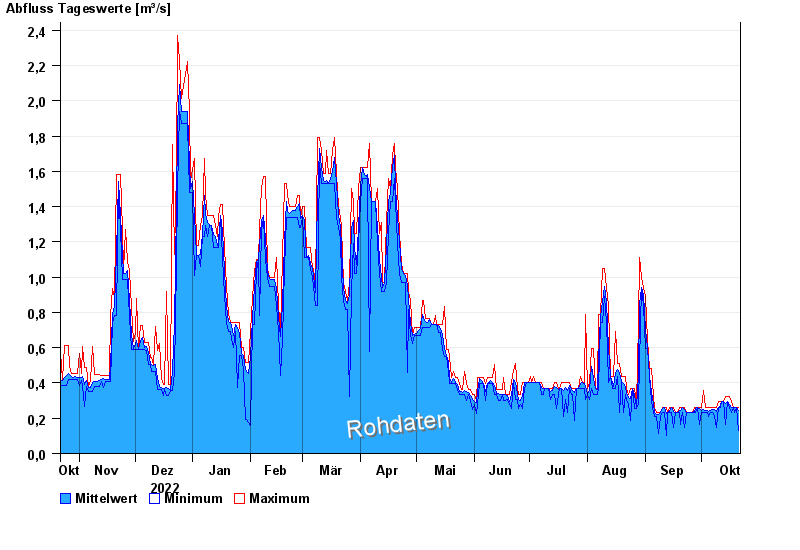
- Chart of year

Chart of year Hocha Perlseeabfluss / Schwarzach
Discharge from 22.10.2022 to 21.10.2023
| Date | Mean value [m³/s] | Maximum [m³/s] | Minimum [m³/s] |
|---|---|---|---|
| 21.10.2023 | 0.242 | 0.263 | 0.13 |
| 20.10.2023 | 0.263 | 0.263 | 0.263 |
| 19.10.2023 | 0.263 | 0.263 | 0.235 |
| 18.10.2023 | 0.263 | 0.263 | 0.263 |
| 17.10.2023 | 0.262 | 0.293 | 0.235 |
| 16.10.2023 | 0.279 | 0.325 | 0.263 |
| 15.10.2023 | 0.294 | 0.325 | 0.293 |
© Bayerisches Landesamt für Umwelt 2024