
- Start >
- Rivers >
- Discharge >
- Naab - Regen >
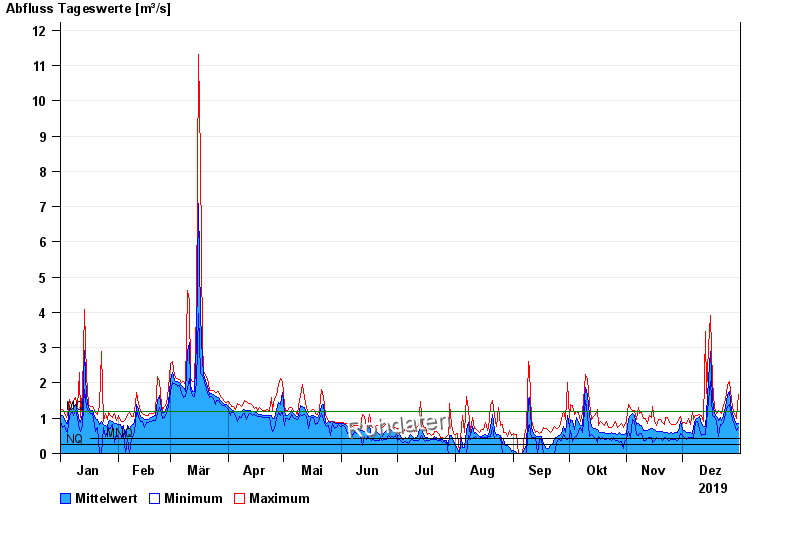
- Lohma Q >
- Chart of year

Chart of year Lohma Q / Zottbach
Discharge from 01.01.2019 to 31.12.2019
 Für diesen Pegel sind keine Hauptwerte hinterlegt.
note
Abflusswerte sind Werte der Ultraschallanlage!
| Date | Mean value [m³/s] | Maximum [m³/s] | Minimum [m³/s] |
|---|---|---|---|
| 31.12.2019 | 0.849 | 1.68 | 0.75 |
| 30.12.2019 | 0.822 | 0.98 | 0.65 |
| 29.12.2019 | 0.925 | 1.14 | 0.81 |
| 28.12.2019 | 1.06 | 1.17 | 0.87 |
| 27.12.2019 | 1.21 | 1.53 | 1.09 |
| 26.12.2019 | 1.76 | 2.03 | 1.39 |
| 25.12.2019 | 1.65 | 1.92 | 1.33 |
© Bayerisches Landesamt für Umwelt 2025