
- Start >
- Rivers >
- Discharge >
- Naab - Regen >
- Lorenzreuth >
- Chart of year

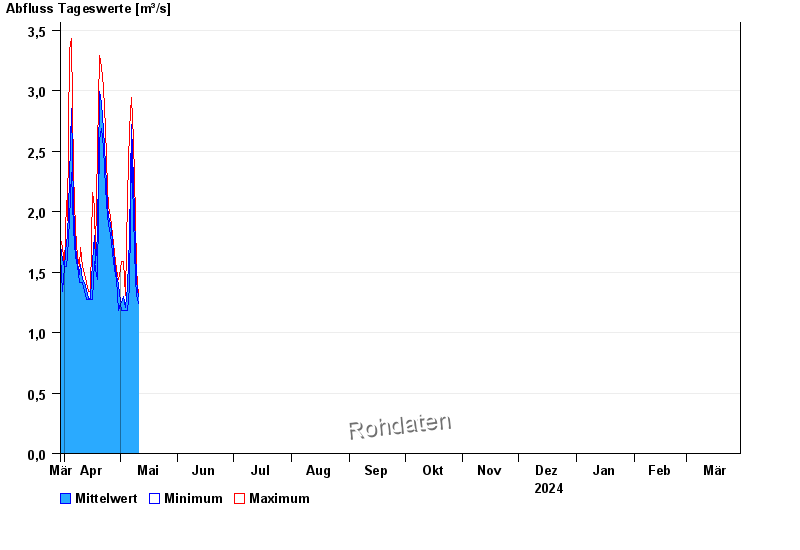
Chart of year Lorenzreuth / Röslau
Discharge from 30.03.2024 to 29.03.2025
| Date | Mean value [m³/s] | Maximum [m³/s] | Minimum [m³/s] |
|---|---|---|---|
| 08.01.2025 | 2.89 | 3.45 | 2.58 |
| 07.01.2025 | 4.23 | 4.81 | 3.45 |
| 06.01.2025 | 3.77 | 4.1 | 3.27 |
| 05.01.2025 | 1.75 | 3.27 | 1.51 |
| 04.01.2025 | 1.53 | 1.58 | 1.51 |
| 03.01.2025 | 1.7 | 1.95 | 1.58 |
| 02.01.2025 | 1.76 | 2.1 | 1.51 |
© Bayerisches Landesamt für Umwelt 2025