
- Start >
- Rivers >
- Discharge >
- Naab - Regen >
- Obersdorf >
- Chart of year

Chart of year Obersdorf / Rosenbach
Discharge from 01.01.2022 to 31.12.2022
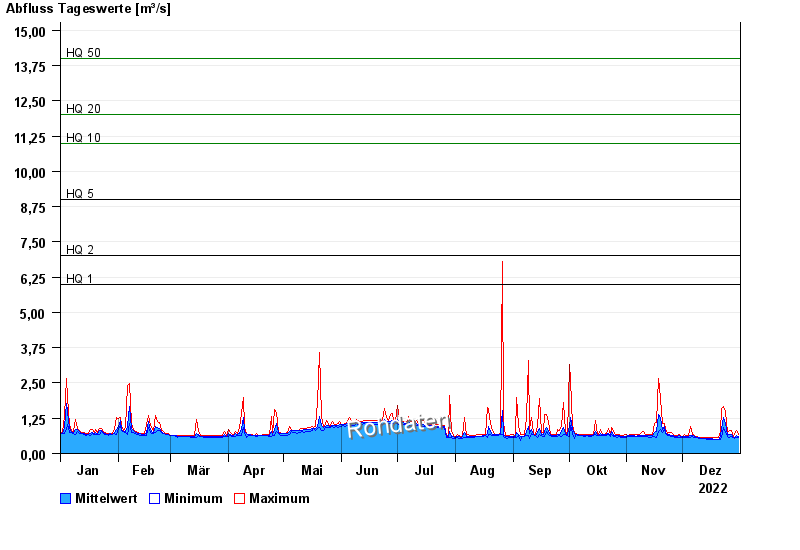
- HQ1 6 m³/s
- HQ2 7 m³/s
- HQ5 9 m³/s
- HQ10 11 m³/s
- HQ20 12 m³/s
- HQ50 14 m³/s
- HQ100 16 m³/s
| Date | Mean value [m³/s] | Maximum [m³/s] | Minimum [m³/s] |
|---|---|---|---|
| 31.12.2022 | 0.609 | 0.687 | 0.551 |
| 30.12.2022 | 0.654 | 0.815 | 0.575 |
| 29.12.2022 | 0.559 | 0.657 | 0.523 |
| 28.12.2022 | 0.571 | 0.601 | 0.551 |
| 27.12.2022 | 0.682 | 0.815 | 0.601 |
| 26.12.2022 | 0.662 | 0.815 | 0.551 |
| 25.12.2022 | 0.654 | 0.748 | 0.601 |
© Bayerisches Landesamt für Umwelt 2024