
- Start >
- Rivers >
- Discharge >
- Naab - Regen >
- Pfrentsch >
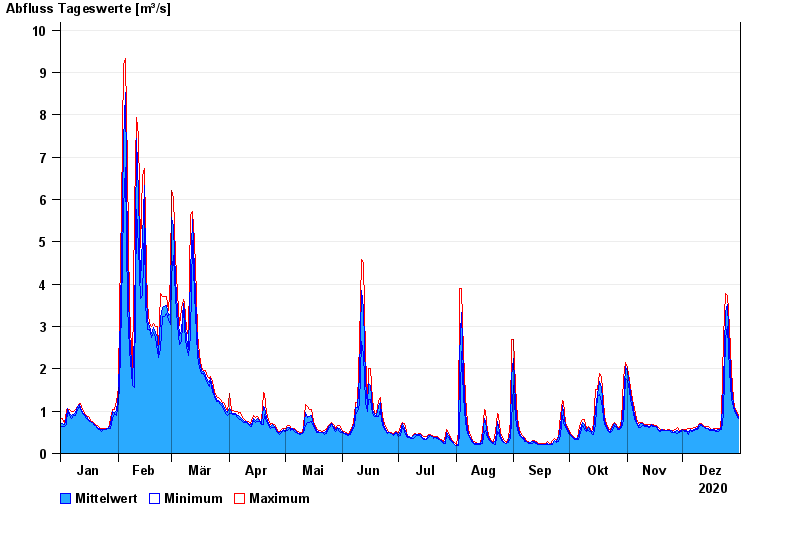
- Chart of year

Chart of year Pfrentsch / Pfreimd
Discharge from 01.01.2020 to 31.12.2020
| Date | Mean value [m³/s] | Maximum [m³/s] | Minimum [m³/s] |
|---|---|---|---|
| 31.12.2020 | 0.856 | 0.892 | 0.818 |
| 30.12.2020 | 0.938 | 1.01 | 0.888 |
| 29.12.2020 | 1.03 | 1.09 | 1 |
| 28.12.2020 | 1.16 | 1.29 | 1.09 |
| 27.12.2020 | 1.55 | 1.93 | 1.28 |
| 26.12.2020 | 2.46 | 3.01 | 1.93 |
| 25.12.2020 | 3.51 | 3.74 | 3.01 |
© Bayerisches Landesamt für Umwelt 2025