
- Start >
- Rivers >
- Discharge >
- Untere Donau >
- Arzberg >
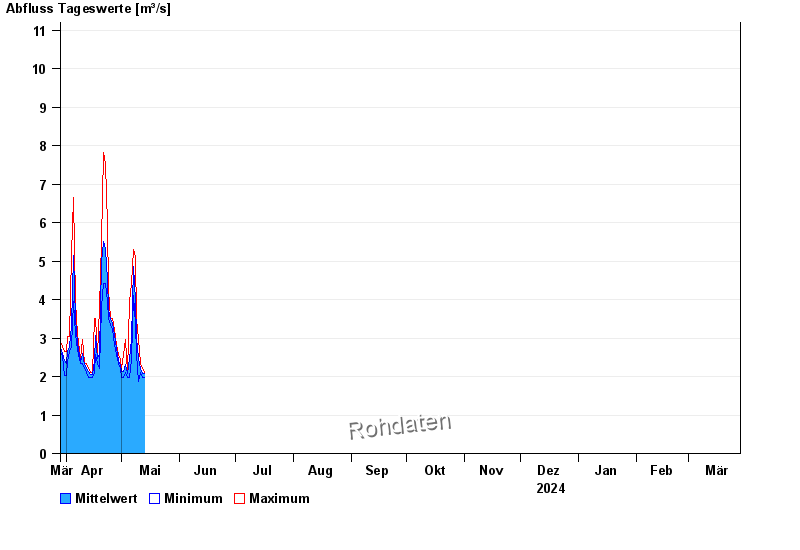
- Chart of year

Chart of year Arzberg / Röslau
Discharge from 29.03.2024 to 28.03.2025
- 01.09.1977 Abfluss: 89 m³/s
- 01.11.1998 Abfluss: 84,2 m³/s
- 06.01.1982 Abfluss: 82,9 m³/s
- 28.05.2006 Abfluss: 81,6 m³/s
- 06.02.1980 Abfluss: 80,5 m³/s
| Date | Mean value [m³/s] | Maximum [m³/s] | Minimum [m³/s] |
|---|---|---|---|
| 16.08.2024 | 0.94 | 1 | 0.859 |
| 15.08.2024 | 0.998 | 1.16 | 0.926 |
| 14.08.2024 | 1.07 | 1.24 | 1 |
| 13.08.2024 | 1.05 | 1.16 | 0.926 |
| 12.08.2024 | 1.1 | 1.24 | 1 |
| 11.08.2024 | 1.09 | 1.16 | 1 |
| 10.08.2024 | 1.16 | 1.24 | 1.08 |
© Bayerisches Landesamt für Umwelt 2024