
- Start >
- Rivers >
- Discharge >
- Untere Donau >
- Deggendorf >
- Chart of year

Chart of year Deggendorf / Kollbach
Discharge from 01.01.2024 to 31.12.2024
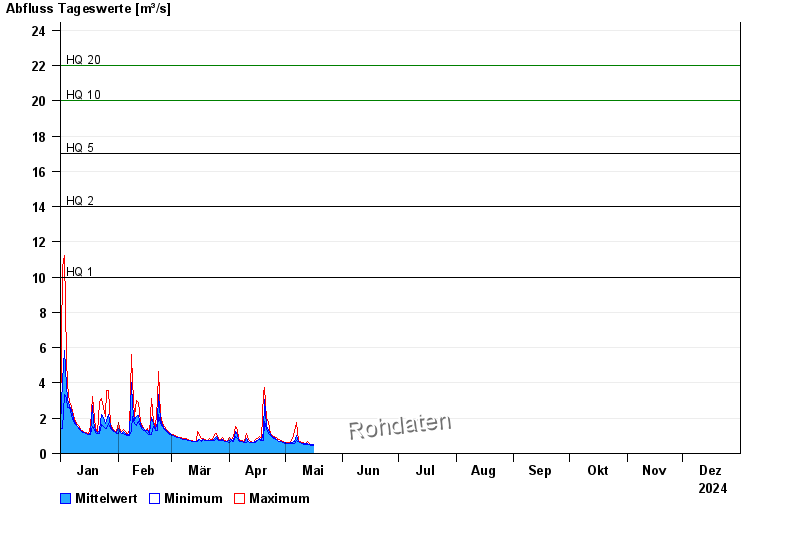
- HQ1 10 m³/s
- HQ2 14 m³/s
- HQ5 17 m³/s
- HQ10 20 m³/s
- HQ20 22 m³/s
- HQ50 25 m³/s
- HQ100 27 m³/s
| Date | Mean value [m³/s] | Maximum [m³/s] | Minimum [m³/s] |
|---|---|---|---|
| 06.10.2024 | 0.474 | 0.477 | 0.432 |
| 05.10.2024 | 0.484 | 0.525 | 0.477 |
| 04.10.2024 | 0.506 | 0.525 | 0.477 |
| 03.10.2024 | 0.808 | 1.09 | 0.664 |
| 02.10.2024 | 0.902 | 1.45 | 0.56 |
| 01.10.2024 | 0.56 | 0.56 | 0.56 |
| 30.09.2024 | 0.599 | 0.611 | 0.56 |
© Bayerisches Landesamt für Umwelt 2024