
- Start >
- Rivers >
- Discharge >
- Untere Donau >
- Donauwörth >
- Chart of year

Chart of year Donauwörth / Donau
Discharge from 11.05.2021 to 10.05.2022
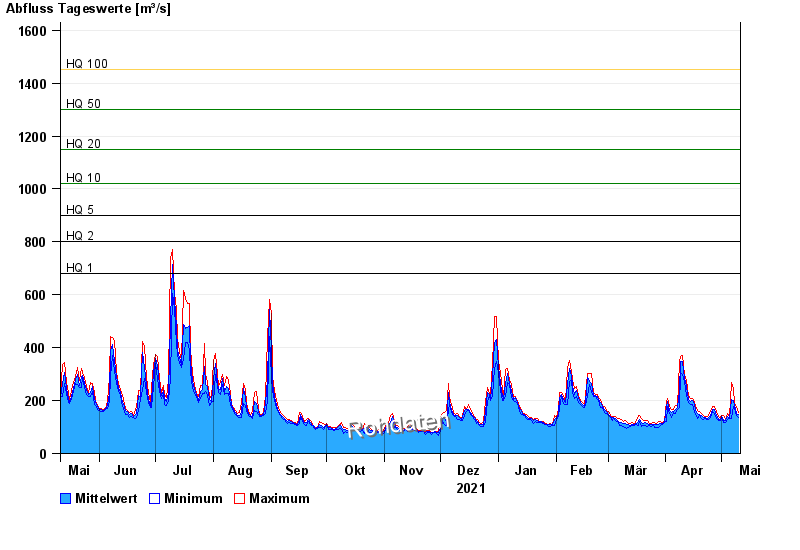
- HQ1 680 m³/s
- HQ2 800 m³/s
- HQ5 900 m³/s
- HQ10 1020 m³/s
- HQ20 1150 m³/s
- HQ50 1300 m³/s
- HQ100 1450 m³/s
| Date | Mean value [m³/s] | Maximum [m³/s] | Minimum [m³/s] |
|---|---|---|---|
| 10.05.2022 | 146 | 154 | 136 |
| 09.05.2022 | 152 | 178 | 144 |
| 08.05.2022 | 182 | 188 | 171 |
| 07.05.2022 | 202 | 247 | 178 |
| 06.05.2022 | 203 | 268 | 132 |
| 05.05.2022 | 133 | 138 | 132 |
| 04.05.2022 | 139 | 151 | 127 |
© Bayerisches Landesamt für Umwelt 2024