
- Start >
- Rivers >
- Discharge >
- Untere Donau >
- Grafenau >
- Chart of year

Chart of year Grafenau / Kleine Ohe
Discharge from 30.07.2021 to 29.07.2022
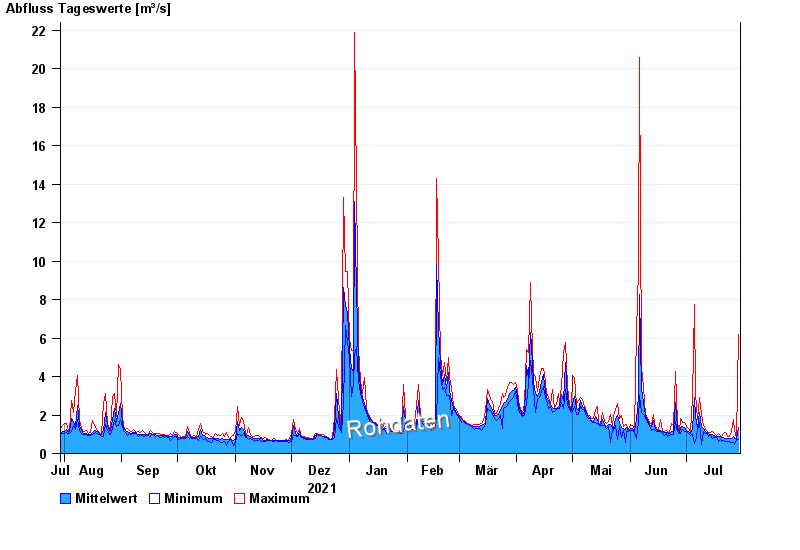
| Date | Mean value [m³/s] | Maximum [m³/s] | Minimum [m³/s] |
|---|---|---|---|
| 29.07.2022 | 1.3 | 6.06 | 0.681 |
| 28.07.2022 | 0.724 | 0.753 | 0.683 |
| 27.07.2022 | 0.76 | 0.827 | 0.683 |
| 26.07.2022 | 0.852 | 1.11 | 0.719 |
| 25.07.2022 | 0.724 | 0.793 | 0.686 |
| 24.07.2022 | 0.74 | 0.832 | 0.653 |
| 23.07.2022 | 0.744 | 0.833 | 0.654 |
© Bayerisches Landesamt für Umwelt 2024