
- Start >
- Rivers >
- Discharge >
- Untere Donau >
- Grafenau >
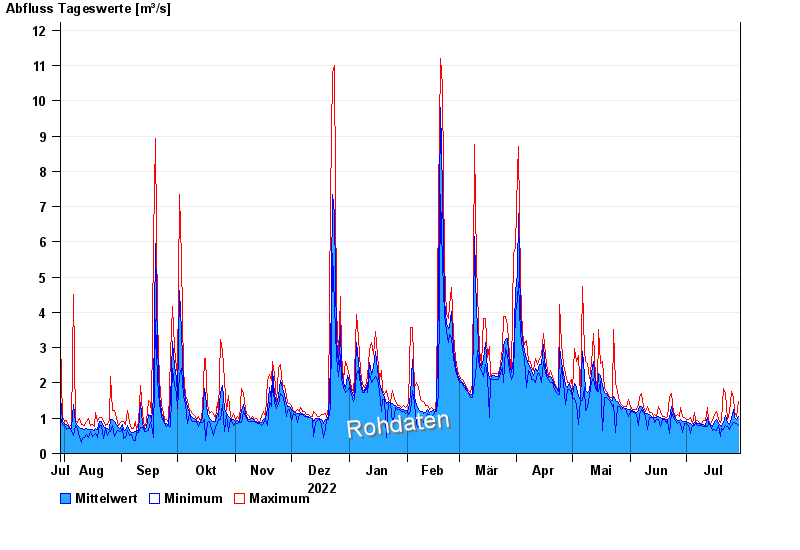
- Chart of year

Chart of year Grafenau / Kleine Ohe
Discharge from 30.07.2022 to 29.07.2023
| Date | Mean value [m³/s] | Maximum [m³/s] | Minimum [m³/s] |
|---|---|---|---|
| 29.07.2023 | 0.735 | 0.902 | 0.572 |
| 28.07.2023 | 0.67 | 0.728 | 0.604 |
| 27.07.2023 | 0.728 | 0.869 | 0.605 |
| 26.07.2023 | 0.9 | 1.23 | 0.577 |
| 25.07.2023 | 0.72 | 1.35 | 0.549 |
| 24.07.2023 | 0.595 | 0.671 | 0.493 |
| 23.07.2023 | 0.618 | 0.673 | 0.551 |
© Bayerisches Landesamt für Umwelt 2024