
- Start >
- Rivers >
- Discharge >
- Untere Donau >
- Harburg >
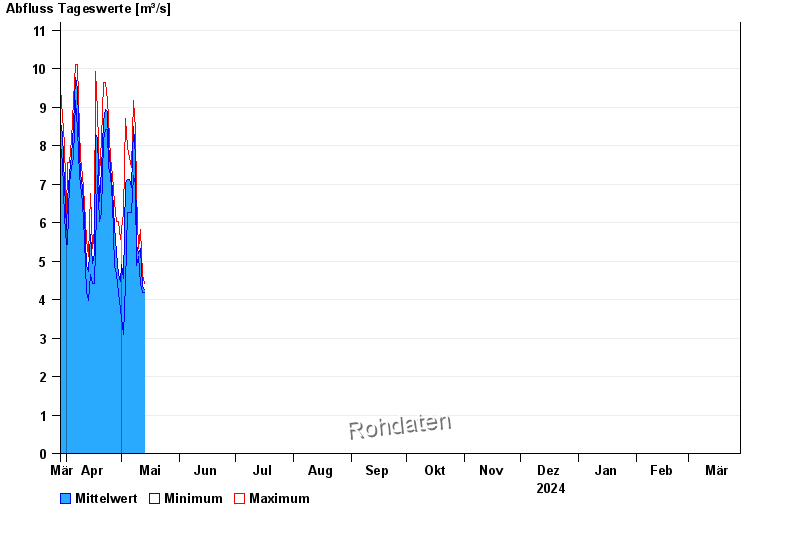
- Chart of year

Chart of year Harburg / Wörnitz
Discharge from 29.03.2024 to 28.03.2025
| Date | Mean value [m³/s] | Maximum [m³/s] | Minimum [m³/s] |
|---|---|---|---|
| 11.08.2024 | 3.99 | 4.01 | 3.8 |
| 10.08.2024 | 2.79 | 3.8 | 2.17 |
| 09.08.2024 | 4.67 | 6.27 | 2.73 |
| 08.08.2024 | 5.93 | 6.98 | 4.01 |
| 07.08.2024 | 4.29 | 4.45 | 4.01 |
| 06.08.2024 | 4.87 | 5.35 | 4.45 |
| 05.08.2024 | 4.92 | 5.35 | 4.68 |
© Bayerisches Landesamt für Umwelt 2024