
- Start >
- Rivers >
- Discharge >
- Untere Donau >
- Hörmannsberg >
- Chart of year

Chart of year Hörmannsberg / Gaißa
Discharge from 20.04.2024 to 19.04.2025
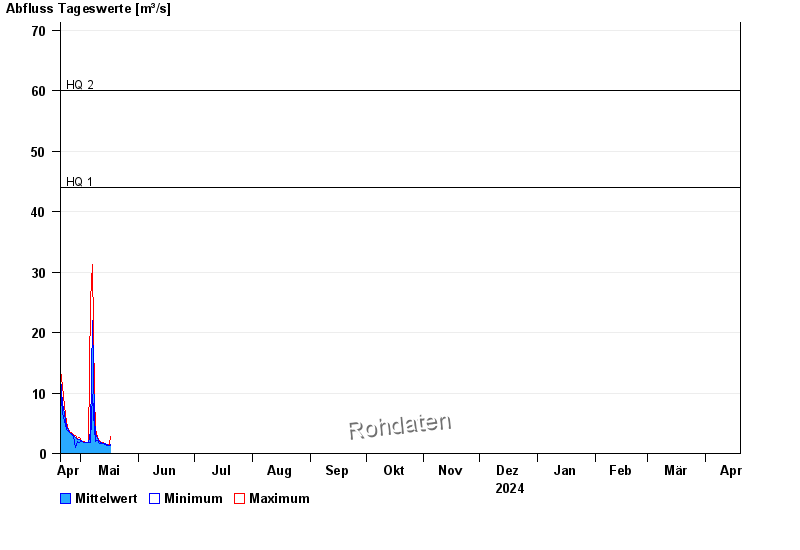
- HQ1 44 m³/s
- HQ2 60 m³/s
- HQ5 75 m³/s
- HQ10 90 m³/s
- HQ20 120 m³/s
- HQ50 135 m³/s
- HQ100 160 m³/s
| Date | Mean value [m³/s] | Maximum [m³/s] | Minimum [m³/s] |
|---|---|---|---|
| 25.12.2024 | 4.43 | 5.04 | 3.99 |
| 24.12.2024 | 5.79 | 6.72 | 5.04 |
| 23.12.2024 | 12.4 | 19.7 | 6.9 |
| 22.12.2024 | 15.7 | 28.5 | 2.24 |
| 21.12.2024 | 2.55 | 3.19 | 2.03 |
| 20.12.2024 | 2.43 | 3.44 | 1.33 |
| 19.12.2024 | 1.95 | 2.03 | 1.84 |
© Bayerisches Landesamt für Umwelt 2024