
- Start >
- Rivers >
- Discharge >
- Untere Donau >
- Hörmannsberg >
- Chart of year

Chart of year Hörmannsberg / Gaißa
Discharge from 26.09.2023 to 25.09.2024
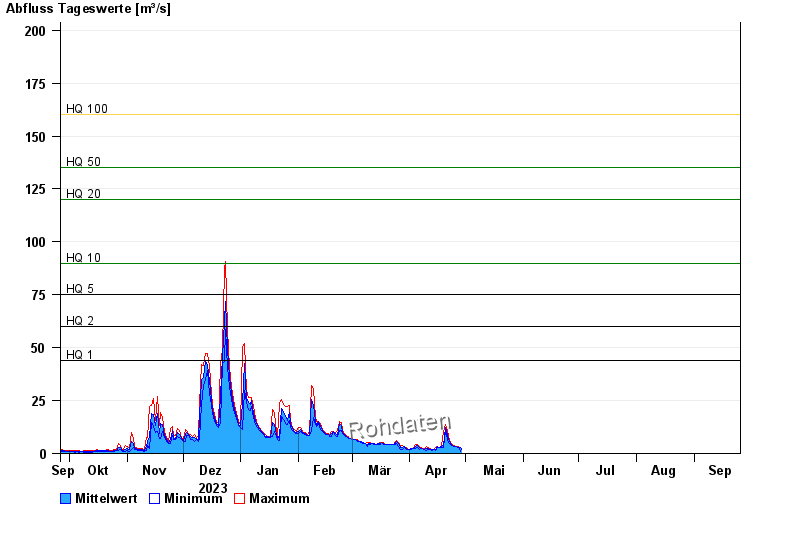
- HQ1 44 m³/s
- HQ2 60 m³/s
- HQ5 75 m³/s
- HQ10 90 m³/s
- HQ20 120 m³/s
- HQ50 135 m³/s
- HQ100 160 m³/s
| Date | Mean value [m³/s] | Maximum [m³/s] | Minimum [m³/s] |
|---|---|---|---|
| 25.09.2024 | 1.64 | 2.52 | 1.16 |
| 24.09.2024 | 1.6 | 2.64 | 1.03 |
| 23.09.2024 | 1.09 | 2.09 | 0.588 |
| 22.09.2024 | 1.18 | 1.38 | 1.16 |
| 21.09.2024 | 1.25 | 1.46 | 1.16 |
| 20.09.2024 | 1.3 | 1.46 | 0.96 |
| 19.09.2024 | 1.6 | 1.99 | 1.09 |
© Bayerisches Landesamt für Umwelt 2024