
- Start >
- Rivers >
- Discharge >
- Untere Donau >
- Inkofen >
- Chart of year

Chart of year Inkofen / Amper
Discharge from 04.07.2023 to 03.07.2024
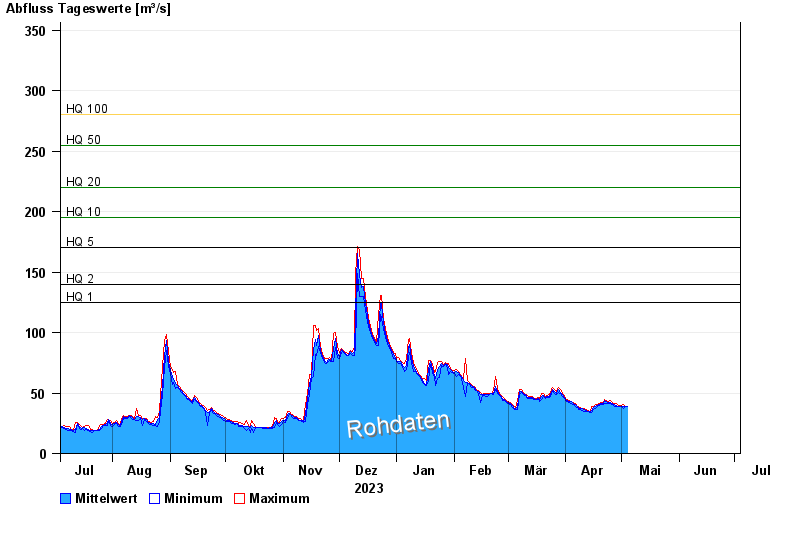
- HQ1 125 m³/s
- HQ2 140 m³/s
- HQ5 170 m³/s
- HQ10 195 m³/s
- HQ20 220 m³/s
- HQ50 255 m³/s
- HQ100 280 m³/s
| Date | Mean value [m³/s] | Maximum [m³/s] | Minimum [m³/s] |
|---|---|---|---|
| 03.07.2024 | 72.2 | 72.6 | 71.4 |
| 02.07.2024 | 72.7 | 73.2 | 72 |
| 01.07.2024 | 73.5 | 77.9 | 70.2 |
| 30.06.2024 | 74.2 | 75.6 | 73.2 |
| 29.06.2024 | 75.9 | 78.6 | 72.6 |
| 28.06.2024 | 80.8 | 84.8 | 78.6 |
| 27.06.2024 | 87.4 | 91.1 | 79.2 |
© Bayerisches Landesamt für Umwelt 2024