
- Start >
- Rivers >
- Discharge >
- Untere Donau >
- Köfering >
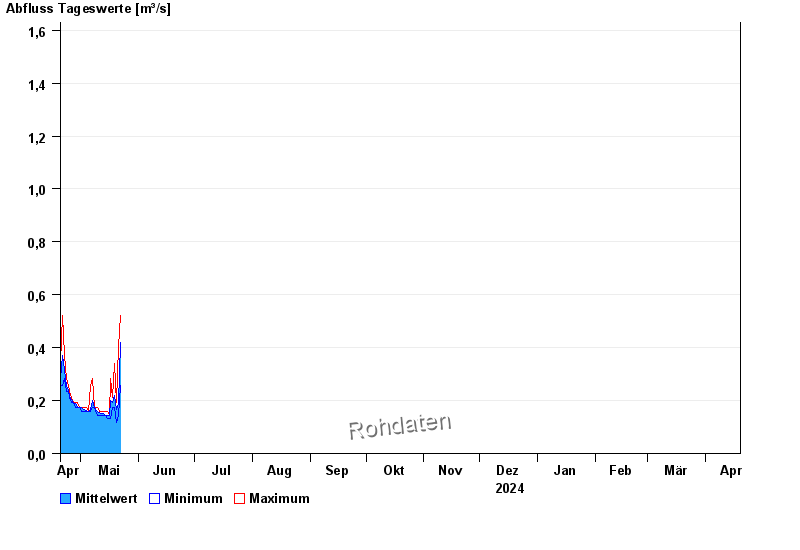
- Chart of year

Chart of year Köfering / Pfatter
Discharge from 20.04.2024 to 19.04.2025
- HQ1 3,7 m³/s
- HQ2 5,4 m³/s
- HQ5 7,9 m³/s
- HQ10 10,1 m³/s
- HQ20 12,4 m³/s
- HQ50 15,9 m³/s
- HQ100 18,9 m³/s
| Date | Mean value [m³/s] | Maximum [m³/s] | Minimum [m³/s] |
|---|---|---|---|
| 15.10.2024 | 1.95 | 2.43 | 1.35 |
| 14.10.2024 | 0.425 | 1.47 | 0.299 |
| 13.10.2024 | 0.327 | 0.353 | 0.299 |
| 12.10.2024 | 0.329 | 0.384 | 0.325 |
| 11.10.2024 | 0.338 | 0.353 | 0.325 |
| 10.10.2024 | 0.342 | 0.353 | 0.325 |
| 09.10.2024 | 0.413 | 0.491 | 0.353 |
© Bayerisches Landesamt für Umwelt 2024