
- Start >
- Rivers >
- Discharge >
- Untere Donau >
- Kothmaißling >
- Chart of year

Chart of year Kothmaißling / Chamb
Discharge from 01.01.2019 to 31.12.2019
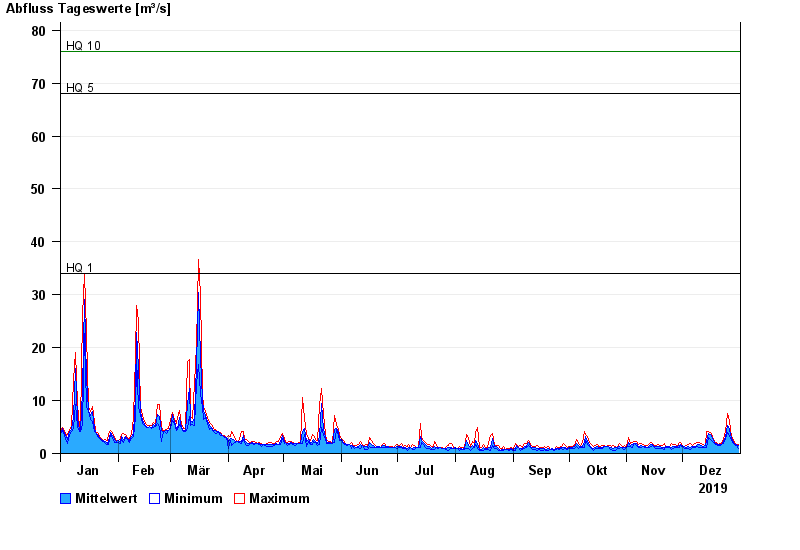
- HQ1 34 m³/s
- HQ5 68 m³/s
- HQ10 76 m³/s
- HQ20 84 m³/s
- HQ50 93 m³/s
- HQ100 101 m³/s
| Date | Mean value [m³/s] | Maximum [m³/s] | Minimum [m³/s] |
|---|---|---|---|
| 31.12.2019 | 1.61 | 1.77 | 1.12 |
| 30.12.2019 | 1.68 | 1.77 | 1.53 |
| 29.12.2019 | 1.84 | 1.93 | 1.77 |
| 28.12.2019 | 2.01 | 2.18 | 1.84 |
| 27.12.2019 | 2.45 | 2.74 | 2.18 |
| 26.12.2019 | 3.45 | 4.44 | 2.74 |
| 25.12.2019 | 3.88 | 5.37 | 3.15 |
© Bayerisches Landesamt für Umwelt 2025