
- Start >
- Rivers >
- Discharge >
- Untere Donau >
- Kothmaißling >
- Chart of year

Chart of year Kothmaißling / Chamb
Discharge from 01.01.2022 to 31.12.2022
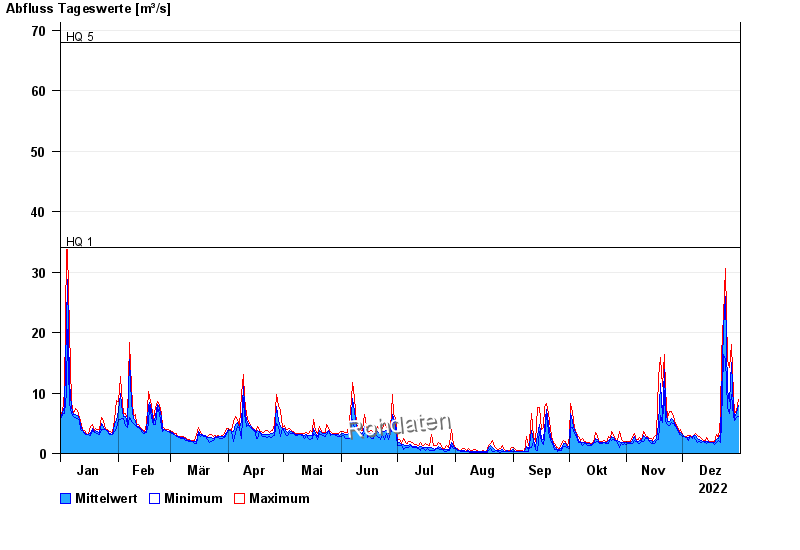
- HQ1 34 m³/s
- HQ5 68 m³/s
- HQ10 76 m³/s
- HQ20 84 m³/s
- HQ50 93 m³/s
- HQ100 101 m³/s
| Date | Mean value [m³/s] | Maximum [m³/s] | Minimum [m³/s] |
|---|---|---|---|
| 31.12.2022 | 6.65 | 7.34 | 5.45 |
| 30.12.2022 | 5.71 | 6.15 | 5.31 |
| 29.12.2022 | 5.33 | 5.73 | 4.91 |
| 28.12.2022 | 6.39 | 7.95 | 5.45 |
| 27.12.2022 | 12.2 | 14.7 | 7.95 |
| 26.12.2022 | 7.22 | 11.7 | 5.72 |
| 25.12.2022 | 8.6 | 12.4 | 6.44 |
© Bayerisches Landesamt für Umwelt 2025